Positive second quarter results continue to build on momentum from earlier in the year
After a strong start to the year, continued momentum in property fundamentals led to another quarter of positive returns across the majority of the portfolio.
In our Q1 letter to investors, we highlighted our view that with interest rates stabilizing we expected continued improvement in property fundamentals to result in further positive gains over the next several quarters.
As anticipated, this held true through the second quarter where once again we saw the benefits that being invested in the right locations and the right asset types can have on performance despite the ongoing headwinds created by sustained higher borrowing costs.
| Q1 | Q2 | YTD | |
|---|---|---|---|
| Flagship Real Estate Fund | 2.45% | 2.21% | 4.72% |
| Income Real Estate Fund | 1.85% | 2.10% | 4.03% |
Although inflation continued to edge downward, we saw (on average) both occupancy and rent rebound through the spring, as we successfully captured what is historically the strong leasing season in most markets.
While there can never be a guarantee of future performance, we believe real estate assets have largely returned to their more normalized historical growth rates of roughly 2% per quarter — for both residential and industrial assets as well as fixed-income strategies.
Strong opportunities remain for higher returns
Meanwhile, we continued to actively deploy into both new equity and credit investments, capitalizing on persistently elevated rates to deliver much higher than average fixed income returns, as well as acquire new assets at what we believe are temporarily depressed prices.
Two of the more recent examples of this include:
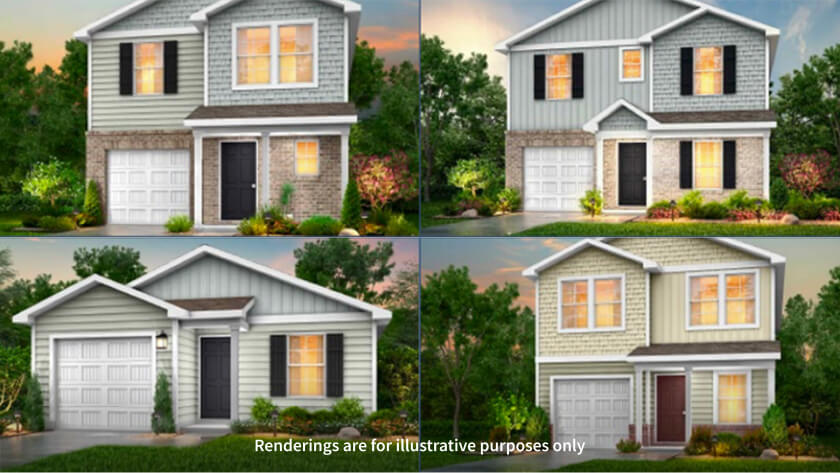
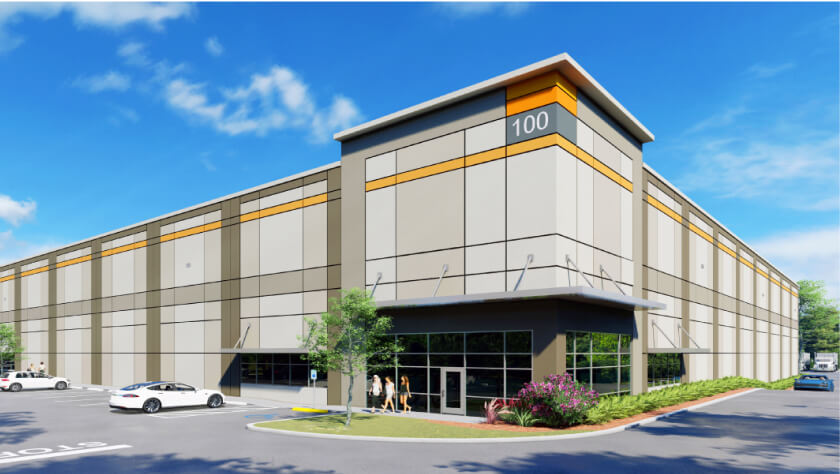
The Highlands and Highpoint Commerce Center are just a few examples of projects purchased during this time period. For a full list of projects powering Fundrise portfolios, see www.fundrise.com/assets.
In other words, being active in the market today when there are few other competitors is allowing us to capture what we feel are uniquely attractive and temporarily outsized returns which have the potential to result in better performance for investors over the next several years.
Capturing the AI tidal wave
At the same time that we’ve been active in the real estate and private credit markets, we have also been expanding access to our Innovation Fund for more and more investors — and doing so just as demand for new AI technologies is exploding.
Of course, there is no better evidence of this tidal wave of growth than the recent performance of Nvidia, the microchips manufacturer for AI, whose stock is alone responsible for nearly 40% of the returns of the entire S&P 500 so far this year.
While there will of course be long and ongoing debates about the true merits of AI (or what AI even means exactly), what’s clear for investors is that this rapidly expanding technology has the potential to drive generational type returns (like the internet, mobile, and cloud computing breakthroughs before it). However, just as in each previous tech wave, a disproportionate share of those returns stand to be captured by a select few number of venture funds and their managers.
Enter the Fundrise Innovation Fund. Over the past year, we’ve built out an AI and data focused portfolio in the Fund that we think rivals that of any major VC investor today. And we’ve done it with the explicit intention of making it available to all, so that any investor who wishes can take part in this potentially $15 trillion dollar wave, without restriction, up-front sales loads, high management fees, or carried interest.
The Fund already manages more than $125 million in assets on behalf of tens of thousands of investors and continues to grow rapidly. We see this as validation of our belief that individual investors — like their institutional counterparts — want the opportunity to own a piece of the best companies, whether they’re public or private.

The advantages of multi-asset class investing
One of the benefits of being active across multiple sectors of the market, in different asset classes, and different investment structures is that it gives us a broader perspective on the fundamental ebbs and flows in both momentum and valuations that is inherent in investing.
-
The Up (2021-2022): The aftershocks from stimulus drove what was arguably the single best run-up in real estate performance in multiple decades.
-
The Down (2023): That was followed by a higher rate environment that led to real estate values falling substantially but created a goldilocks period for fixed income and private credit investing.
-
Back Up (2024-?): Tech and venture capital saw a collapse in 2022, followed by the emergence of the AI tidal wave which may end up being the biggest investment opportunity in our lifetimes.
As a long-term, value based investor, our aim is to help our investors capture a disproportionately larger share of the upside while also, hopefully, experiencing a disproportionately smaller share of the downside. (It’s important to remember that all investing comes with some periods of ups and downs).
Lastly, as always, we’d like to take the opportunity to both thank all our investors for their ongoing support and also remind them of the fundamental principle at the center of our investment ethos which is to be the turtle; patient, deliberate, consistent, and unwavering — for by doing so we can ultimately deliver the best results.
Onward.
Appendix
Exhibit A: 2024 YTD returns of client accounts by individual Fundrise sponsored fund2
| Fund name / Objective | Average principal3 | Launch date | Net return |
|---|---|---|---|
| Registered Funds | |||
| Flagship Real Estate Fund | $1,146,476,702 | Jan 2021 | 4.69% |
| Income Real Estate Fund | $574,703,072 | Apr 2022 | 3.90% |
| Innovation Fund | $127,994,918 | Jul 2022 | 0.92% |
| Growth | |||
| Growth eREIT | $208,020,690 | Feb 2016 | 2.62% |
| Growth eREIT II | $129,781,547 | Sep 2018 | 0.35% |
| Development eREIT | $106,993,269 | Jun 2019 | 0.59% |
| Fundrise eFund | $79,423,448 | Jun 2017 | 0.20% |
| Growth eREIT III | $48,050,466 | Feb 2019 | 4.40% |
| Growth eREIT VII | $72,541,878 | Jan 2021 | 5.71% |
| Balanced | |||
| East Coast eREIT | $113,416,918 | Oct 2016 | -2.27% |
| Heartland eREIT | $73,629,945 | Oct 2016 | 2.31% |
| West Coast eREIT | $72,694,797 | Oct 2016 | 2.51% |
| Balanced eREIT II | $38,721,220 | Jan 2021 | 5.87% |
Exhibit B: 2024 YTD net returns of all client accounts of Fundrise Advisors by investment plan objective4
| Plan objective | Income | Balanced | Growth | Custom | Overall |
|---|---|---|---|---|---|
| Dividends | 2.07% | 0.91% | 0.41% | 1.17% | 0.92% |
| Appreciation | 1.50% | 2.76% | 2.79% | 2.28% | 2.54% |
| Net Total Return | 3.58% | 3.67% | 3.20% | 3.45% | 3.47% |
Exhibit C: Trailing 1-year and since inception cumulative returns of registered funds through June 30, 2024
| 1 year | Since inception | |
|---|---|---|
| Flagship Real Estate Fund | -5.92% | 17.13% |
| Income Real Estate Fund | 8.41% | 17.52% |