Year-end letter to investors - 2021
A year of remarkable results.
In 2021, we welcomed more new investors to Fundrise than during any other year in our now decade-long history. Not only is this a milestone that we are extremely proud of, but it also means that for many of you, this is your first time reading our end-of-year letter.
For context, we tend to use this as an opportunity to cover our performance over the past year, analyze some of the key drivers of that performance, and provide our view on what the next year may hold. We do this in the hope that by sharing our thinking, investors will continue to be better informed about what to expect from us going forward, and as a result, better able to make the appropriate decisions about their own portfolios.
With 2021 now in the rearview mirror, we can definitively state that by nearly every measure it was the single strongest year of results that we’ve delivered to date.
While this appeared to be somewhat of a foregone conclusion after Q3, we were encouraged to see the same macro-driven tailwinds covered in that update continue to propel growth through the last three months of the year.
In the end, the average annual return for all Fundrise client accounts was a notable 22.99% for the year.
However, that average alone is arguably not the best measure of true performance as it combines what are ultimately two distinct strategies. Viewed separately, client accounts with an income objective earned an average total annual return of 17.98%, with 4.96% paid out as dividends, while client accounts with a growth objective achieved a higher average total annual returns of 25.12% but with only 2.92% in dividends (all return figures are net of fees).¹
2021 returns of client accounts by investment plan objective
| Income | Balanced | Growth | Overall | |
|---|---|---|---|---|
| Dividends | 4.96% | 3.70% | 2.92% | 3.63% |
| Appreciation | 13.02% | 19.49% | 22.20% | 19.36% |
| Total Return | 17.98% | 23.18% | 25.12% | 22.99% |
Additionally, our Flagship Interval Fund, which launched in January and within only six months had grown to become one of the 25 largest interval funds in the US² delivered a remarkable average rate of return of 40.56% across all client accounts, during what was anticipated to be a year where returns were likely to be somewhat depressed due to an initial ramp up period. Note that the return figure for client investments is time-weighted, meaning it takes into consideration the date on which investments were made, the fund itself reported a net asset value (NAV) per share of $12.81 on December 31, representing a 28.1% increase over its starting value of $10.00.
(As always it’s important to remember that each client's performance is unique to their portfolio, and of course past performance does not guarantee future results.)
It’s worth restating that we believe achieving this kind of performance, with some property investments appreciating 50% to 100% in a single year, is extremely rare, particularly when considering the relatively low leverage and predominantly core-plus and value-add nature of most of our strategies. And it’s unlikely, in our opinion, that such exceptional performance across such a large swath of assets will be repeated often.
Again, this does not mean that we do not expect to deliver strong performance going forward, on the contrary, doing so is our explicit aim. Nor is it a negative reflection on the overall state of the portfolio. In fact, we feel strongly that the broad thematic strategies we have pursued over the last several years are as well positioned now as they’ve ever been. Instead, we simply believe that being candid about the uniqueness of the circumstances that drove such outsized growth is far superior in the long-run than allowing any sort of over-extrapolation to set unrealistic expectations.
A structurally superior model
What drives performance?
In the past, we’ve often spent a majority of our time in these letters discussing various aspects of our macro-driven thematic investing strategy, whereby we seek to identify and invest behind what we believe to be large multi-decade growth drivers. (If you haven’t already, listen to the first episode of our new podcast Onward where we discuss this idea at length).
By contrast, we’ve devoted less time discussing what we believe is an equally, if not, even more important topic — the structurally superior nature of our cutting-edge investment model. That is to say, the mechanics by which we raise and invest capital (and the underlying technology that facilitates it) is in and of itself a unique competitive advantage of the Fundrise platform apart from the quality of whatever specific asset class or geographic based strategies that we decide to pursue.
Part of the reason this may be less obvious is that while most appreciate the benefits of investing in real estate, few are privy to the inner workings of the real estate investment industry and the ways in which the infrastructure of the existing system tends to put them, as individual investors, at an inherent disadvantage.
When you invest through Fundrise, you are investing through our platform into the private markets. This is, of course, as opposed to the public markets (think publicly traded stocks, ETFs, REITs, etc). Much like a technology startup that raises venture capital and then grows for several years as a private company before “going public” through an IPO, real estate assets (such as apartment buildings, single family rentals, or industrial warehouses) go through a similar life-cycle whereby they are owned and matured in the private markets before effectively “IPOing” as well, most often in the form of a sale to an existing public REIT.
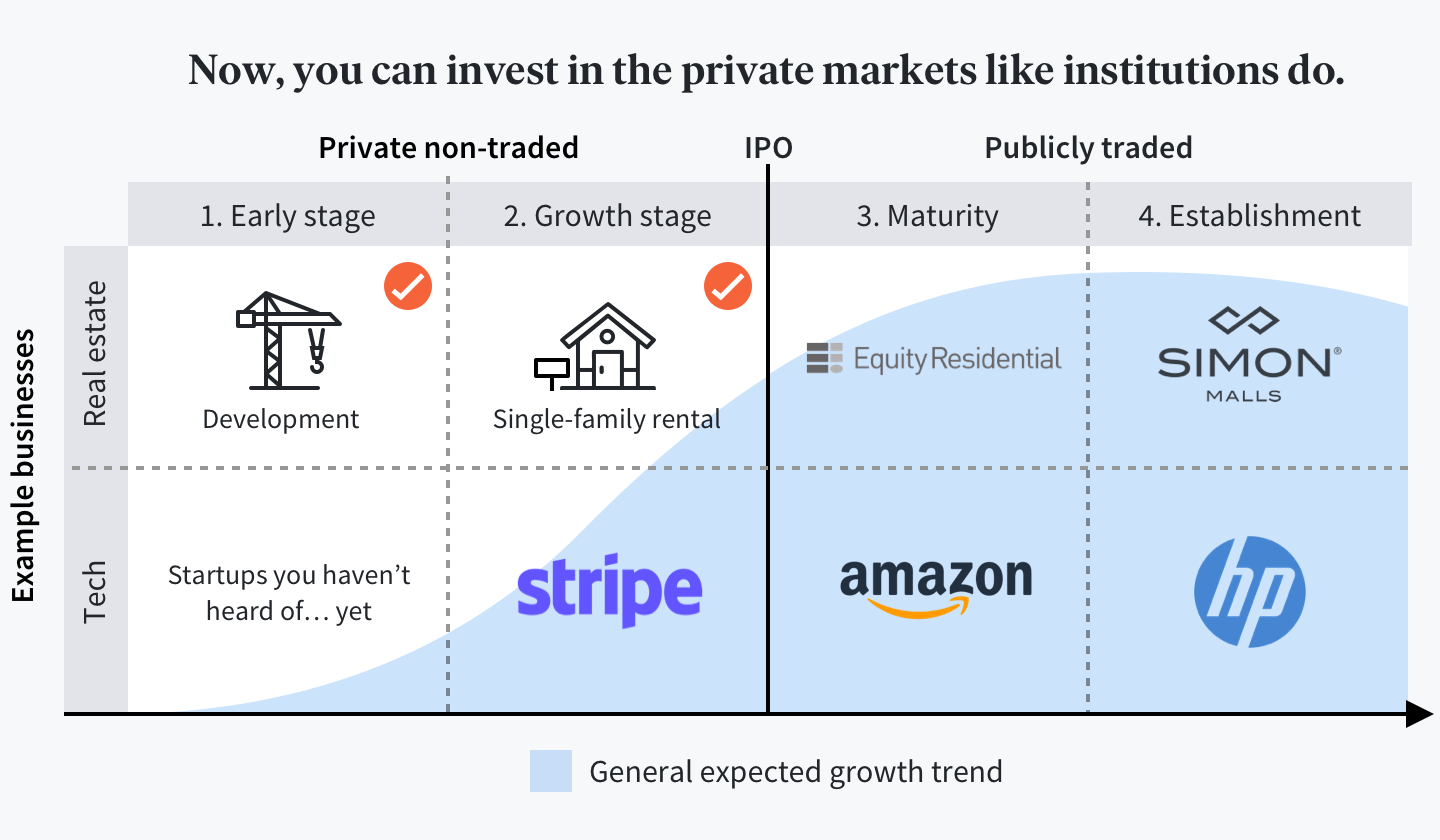
And much like trying to invest in Facebook, Google, or Amazon before they went public, access to private market (i.e. “early stage”) real estate investments is restricted, only available to those who go through a series of institutional channels controlled by intermediaries and gatekeepers, all of whom charge hefty tolls in the form of performance fees, sales commissions, and other transaction costs.
In fact, unless you happen to be old enough to have a pension, most investors simply do not have any feasible way to access the private markets and as a result are limited to investing exclusively in publicly traded stocks.
This matters because when you invest in a company (or real estate asset) once it is in the public markets you are far more often than not paying a higher price, i.e., a premium, vs those who have the ability to buy into the asset while it is still private.
This idea of both disrupting and consolidating the “private equity value chain” lies at the very heart of Fundrise and is something that we plan to discuss in greater length in the near future, but for now to keep things simple it’s sufficient to think of investing through Fundrise like buying something wholesale, whereby regardless of the investment strategy itself our technology is allowing you to get access to the assets at a lower effective cost merely as result of being able to cut out unnecessary middlemen.
(It’s worth noting that we applied this same direct model with our Fundrise iPO giving investors on the platform the opportunity to invest in the parent company itself at a relatively early stage.)
Looking ahead
While the future is always uncertain, today, the potential for what lies ahead feels particularly varied and unpredictable, as the second-order consequences of an unprecedented economic response to a once-in-a-century black swan event continue to play out.
The return of inflation
Arguably the biggest contributor to that uncertainty is inflation, which after 40 years of decline (when some experts even speculated about its permanent disappearance) has reemerged as a powerful and potentially destructive force.
Inflation refers to the phenomenon whereby the general prices of goods and services in an economy steadily increase over time. This in turn causes a decrease in the purchasing value of money. In other words, as prices rise a dollar tomorrow buys you less of any good or service than it buys you today. All else being held equal, inflation acts like a tax on one’s earnings and has the same effect as reducing overall net worth.
It’s hard to overstate the potential significance of a broad shift to an inflationary environment and the changes that could accompany it. Inflation can quickly eat through an economy and what may start out as transitory (e.g., temporary price increases caused by things like short-term supply chain issues) can quickly become a self-reinforcing cycle. As costs for goods go up, businesses tend to raise prices, which in turn makes everything from everyday essentials to cars and vacations more expensive. Unless salaries and assets increase at an equal pace (which they rarely do) people effectively become poorer.
Most concerning is the fact that, as inflation rises, interest rates typically rise as well, both as a result of savers and investors demanding higher rates to offset it, as well as the monetary policy actions taken to try and curb it. As rates rise, all forms of debt — corporate, consumer, and government — become more expensive to service, until at some point it becomes unsustainable, triggering waves of defaults and throwing the market into recession.
Despite this new and very real risk, it’s difficult for many to imagine its actual impact, in part because less than half of the adult working population can even remember a time when inflation was actually relevant. As is a common fallacy associated with large-scale paradigm shifts, because the industrial world has experienced low inflation and falling rates for so long, too many people have been conditioned to think of them as permanent, rather than recognizing the cyclical trend that it is, just one that has been occurring over a longer relative time horizon.
Nowhere is this evidenced more today than in the $119 trillion credit markets where, despite all the data signaling actual inflation will likely reach double digits, creditors are still largely lending at negative real rates, meaning that after inflation most will not only receive no interest but will also get back less than their initial principal.
What could possibly compel this behavior? We see only three logical reasons:
-
Creditors expect inflation, and by extension interest rates, to return to the historic lows of last decade.
-
Creditors are concerned that a significant recession is coming in the next few years and are willing to accept knowingly losing a little bit of money now vs risking potentially losing a lot of money in the future.
Or…
- The credit market is wrong. But the repricing of $119 trillion of low interest rate debt is too frightening and painful a reversal to acknowledge, and so people are simply unwilling to accept a new reality.
“The greatest danger in times of turbulence is not the turbulence — it is to act with yesterday’s logic.” — Peter Drucker
To be clear, it's our belief that we are likely to experience sustained high levels of inflation at minimum through the next year, if not longer, putting investors looking to protect themselves from value erosion in a difficult position. Most individuals will be left in the unenviable spot of having to choose between two equally unsatisfying options. Stocks that may offer better performance but with pricing where it is today also come with some meaningful increase in genuine principal risk, or bonds that currently offer low or even negative real returns.
Fortunately, real estate is one of the few assets that has tended to both be resilient in downturns as well as offer strong performance in inflationary markets. And as we just experienced over the last twelve months, we continue to believe that residential and industrial real estate assets in particular are some of the most well-positioned to hold their value in this environment. This belief has only been further reinforced as we continue to observe more and more large institutional investors increasing their exposure specifically to these types of assets.
What makes real estate an attractive option?
It goes back to an idea we’ve previously discussed at length, which is the difference between tangible real assets (like housing and food) vs. financial assets (like stocks and bonds). Real assets, which offer real economic benefits needed for everyday life, tend to be more resilient because even if actual spending decreases, either as a result of a recession or diminished purchasing power due to inflation, consumers continue to need the utility these assets provide. Financial assets on the other hand are several steps removed from the real asset and tend to be valued more subjectively, being priced in theory based on investors’ expectations of what may occur in the future, but in practice (in our opinion) as much by emotion and momentum as anything else.
We’ve continuously gravitated to residential and industrial assets both because they are supply constrained (i.e., there is more demand for reasonably priced housing and last mile industrial facilities than there are properties available), and because we believe we’re in the early stages of a $1 trillion value transfer from office and retail assets to residential and industrial assets, primarily because of technological revolution and the rise of remote work. In future updates, we plan to go into more depth about this remote work revolution and why generally the essence of our investment thesis has been to target investments with strong growth drivers but fundamental limits on new supply.
Staying skeptical of consensus
There seems to be growing institutional consensus that despite all of the historic changes that have occurred over the past several years, as the economy works its way through the pandemic hangover, things will ultimately normalize more or less back to the way they were. As disruptors by nature, we can’t help but be skeptical of such mainstream group-think.
Instead, it’s our belief that inflation is likely to go higher and exist for longer than many “experts” are forecasting and that the potential for a new paradigm is very real. However, the multitude of consequences that are likely to unfold as a result are too numerous to foresee and so as usual rather than trying to predict the future or develop investment strategies that rely on those predictions always being correct, we instead are drawn back to our basics: identify the big (obvious) drivers of growth, seek out positions of relative value, protect against the downside, and above all let time work for you by focusing on the long-term.
As we look at the year ahead, while cautious, we’re encouraged by the state of the overall portfolio and feel fortunate to have the ability to pursue both the opportunity and security that may (at the moment) only be available outside the stock market. Most importantly we’re proud to be able to say that over the last decade, thanks to Fundrise and the technology that makes it all work, more than a quarter of a million individuals have been given this same ability -- a small but meaningful step in our broader mission of building a better financial system.
We’re excited about several potential new expansions and features that we believe will be significant milestones in furthering this mission and hope to be able to share more with you all very soon.
Until then, onward.
—
P.S. — For a more visual take on 2021 at Fundrise, and some bonus content that didn’t make it into the letter, check out our Year in Review infographic.
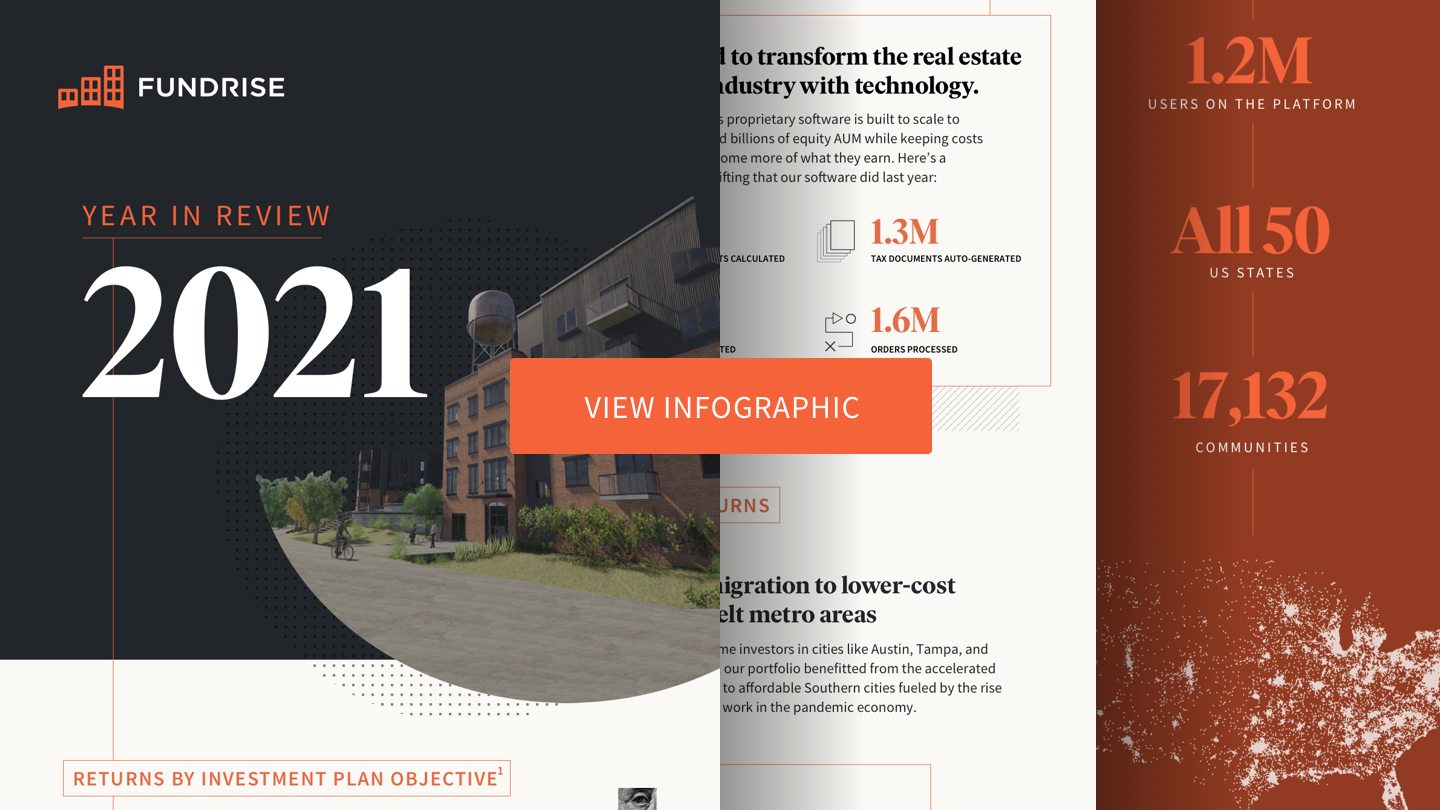
Exhibit A: performance of individual Fundrise sponsored funds, 2021³
| Fund Name / Objective | Average AUM4 | Launch Date | Net Total Return |
|---|---|---|---|
| Registered Funds | |||
| Flagship Interval Fund (Balanced) | $275,578,326 | Jan 2021 | 40.56% |
| Growth | |||
| Growth eREIT | $188,053,104 | Feb 2016 | 41.71% |
| Growth eREIT II | $88,900,603 | Sep 2018 | 33.67% |
| Development eREIT5 | $84,502,676 | Jun 2019 | 3.69% |
| eFund5 | $78,399,838 | Jun 2017 | 3.43% |
| Growth eREIT III | $45,037,575 | Feb 2019 | 46.35% |
| Growth eREIT VI | $43,828,593 | Dec 2019 | 19.86% |
| Growth eREIT V | $26,530,232 | Oct 2019 | 10.97% |
| Growth eREIT VII | $28,838,667 | Jan 2021 | 18.77% |
| Balanced | |||
| East Coast eREIT | $124,699,700 | Oct 2016 | 20.94% |
| West Coast eREIT | $101,938,990 | Oct 2016 | 6.43% |
| Heartland eREIT | $88,393,876 | Oct 2016 | 40.66% |
| eREIT XIV | $46,036,755 | Dec 2019 | 9.30% |
| Balanced eREIT | $43,502,512 | Dec 2019 | 28.49% |
| Balanced eREIT II | $19,065,546 | Jan 2021 | 30.11% |
| Income | |||
| Income eREIT | $150,275,687 | Dec 2015 | 5.87% |
| Income eREIT II | $83,447,547 | Sep 2018 | 6.18% |
| Income eREIT III | $46,315,173 | Feb 2019 | 6.56% |
| Income eREIT 2019 | $43,138,038 | Jun 2019 | 8.46% |
| Income eREIT V | $42,760,760 | Oct 2019 | 7.91% |