The case for real estate in 2025
In our annual letter to investors, we discuss how falling interest rates over the course of the year kicked off what we expect to be an extended period of positive returns for real estate (and private markets more broadly), with the potential for even more positive tailwinds in 2025.
A year ago, we made what many felt was a bold claim that “The hard part was over for real estate”.
Today, with the platform having delivered strong returns across multiple strategies, that conviction has largely been validated. However, what excites us most at this moment isn't what we achieved over the past 12 months — but instead, the potential we see ahead in 2025.
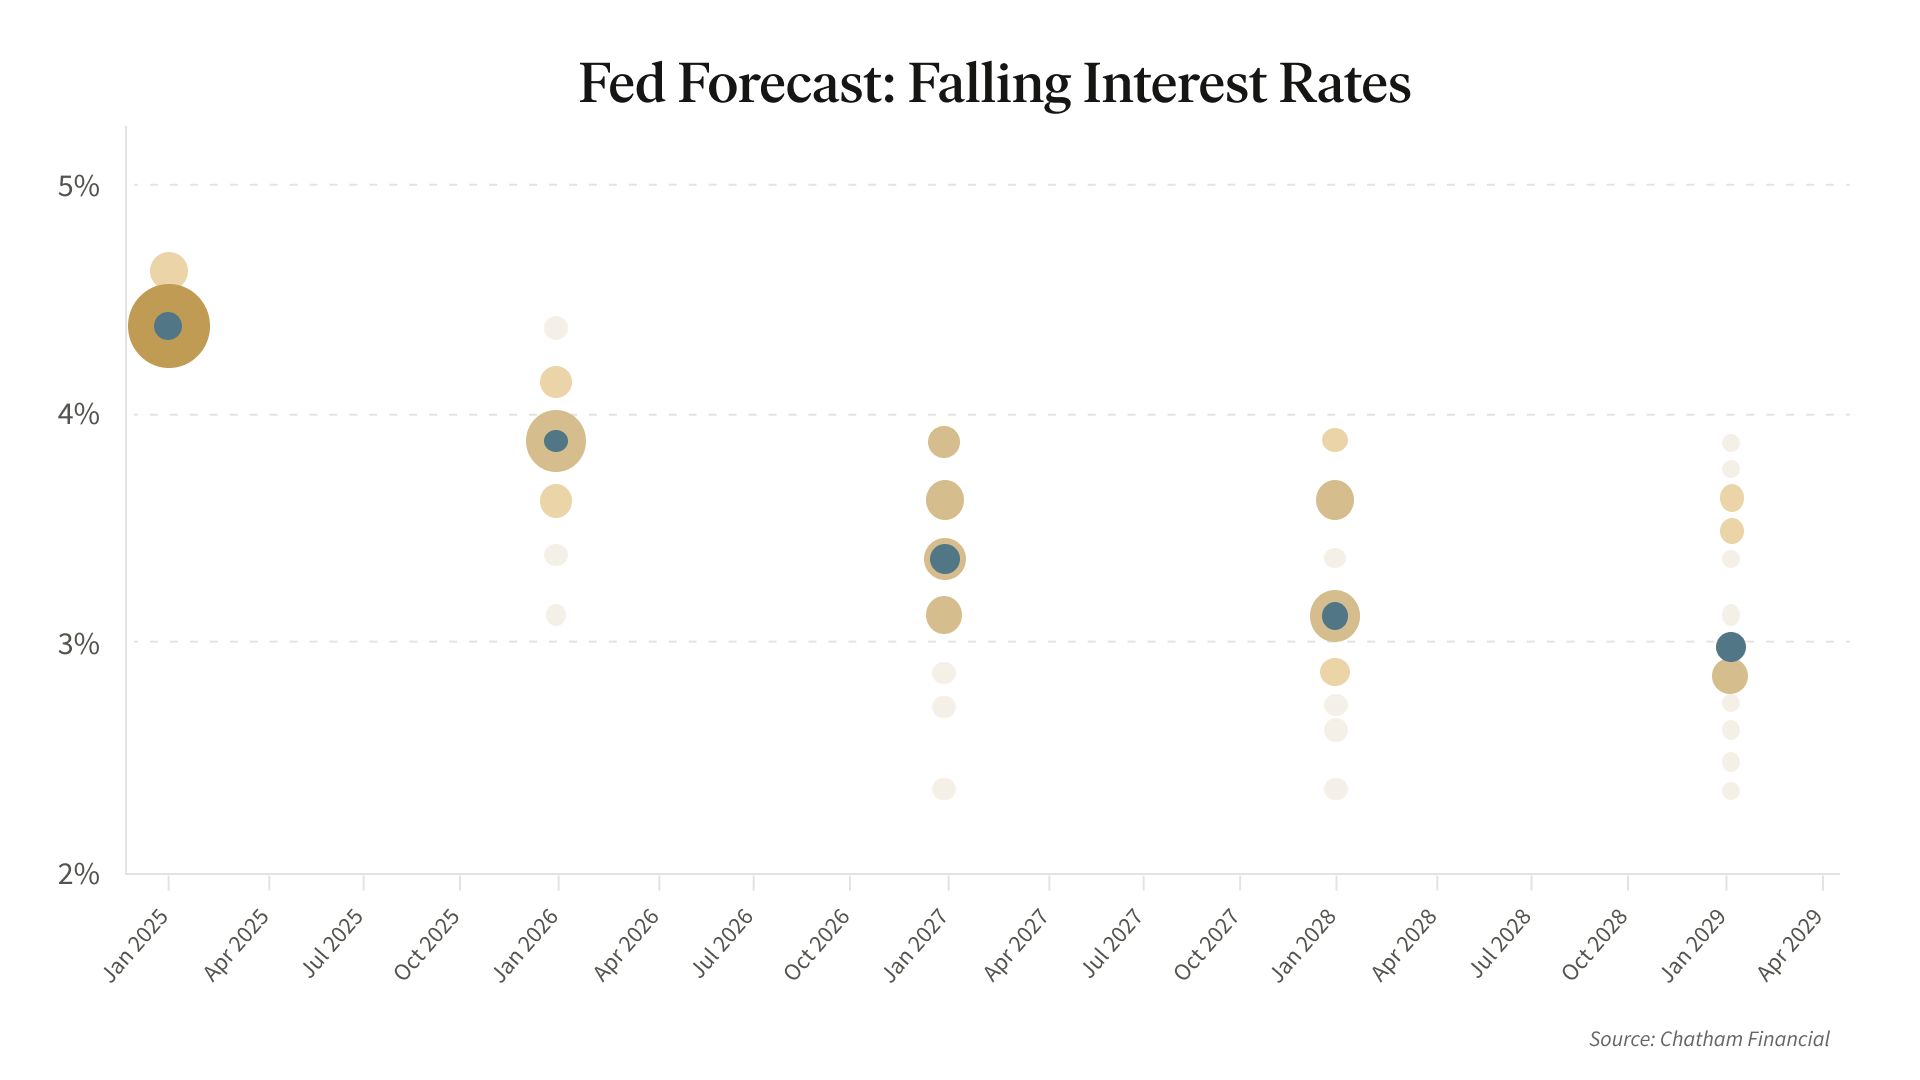
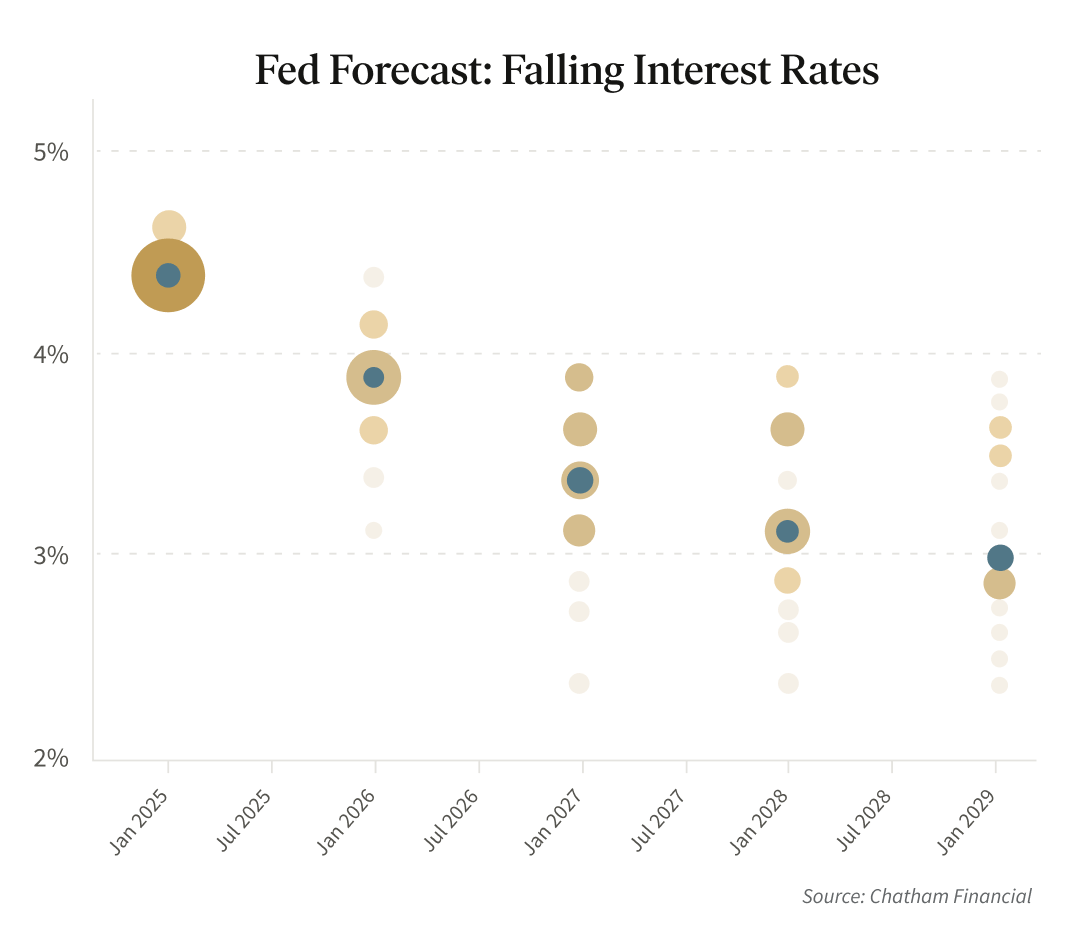
In September, the Federal Reserve began its much anticipated rate cutting cycle, lowering the benchmark Fed Funds rate three times for a total of 100 basis points (or 1%) which in turn translated to positive performance across most every asset class, real estate included.
Performance Summary
The Flagship Real Estate Fund, our largest equity-focused real estate fund, delivered a positive return of approximately 7.50%1 in 2024, which, while not the strongest performance in its history, was a meaningful step in offsetting the negative returns from the previous year.
This is especially true considering the Fed, by its own forecast, is less than halfway through its expected rate cutting cycle, meaning that the potential for similar or larger gains could be achieved as rates continue to come down.
Meanwhile, the value of diversification was on full display with both the Income Fund and the Innovation Fund delivering even stronger performance for the year.
The Income Fund continued to benefit from a goldilocks period for private credit due to the higher interest rate environment, which has continued to create a uniquely attractive risk return profile for many debt and preferred equity investments. The Fund distributed a healthy 7.9% annual dividend and delivered an 8.30% total return1 for the year.
Given the Fund originated more than $75M in new preferred equity investments in 2024 at higher gross returns on average than the existing portfolio, we expect that the current dividend rate should likely continue even as rates fall further.
At the same time, the Innovation Fund grew from relative nascency to being fully deployed into a portfolio of companies that is, by nearly all measures, on par with any of the top venture funds in the industry. This includes having nearly 66% of the Fund deployed into the top six private technology companies in the world according to the annual Forbes and Bessemer Cloud 100 ranking. (OpenAI, Databricks, Stripe, Canva, Anthropic, and ServiceTitan). In total, this translated to an 11.79% return1 for the Fund in only its second full year of operation.
Perhaps most exciting was witnessing the Innovation Fund's core strategy come to fruition over the last month when ServiceTitan (NASDAQ: TTAN) became the first portfolio company to IPO, achieving an immediate 44% pop in share value.
While we are proud of the performance across the platform, we also aim to be transparent with investors. So it’s important to note that the one area of underperformance for the year were the few eREITs that are more heavily focused on development. These funds have a large portion of their portfolios in assets either under construction or still in lease up. And although these funds hold properties at low bases, because they are vacant or only partially leased, they have temporary negative cash flow. This in turn has dragged down their returns over the past year.
Fortunately, we believe that the ongoing resilience of the economy will aid in getting these properties fully leased up, and investors will get to see how the near-term cost of higher negative carry turns into a long-term benefit of larger appreciation in value and hopefully stronger future returns.
In total, across all strategies and Funds, more than 99% of all Fundrise investors experienced positive returns for the year, a mark that we hope to continue to deliver on going forward.
Looking ahead
As we look ahead to 2025, we think there’s good reason to believe that private assets generally and real estate specifically are likely to see another year of strong returns thanks to a combination of both continuing and new tailwinds that together should drive further growth.
1. Rates will continue to come down
We’ve said it so often over the past 18 months that it feels almost cliche to repeat but the fact remains that real estate values move inversely to interest rates. When the Fed raised rates starting in 2022 it had the direct impact of lowering real estate values. Conversely, now that rates have begun to fall, it has had a positive impact on values.
While there may be ongoing debate about both the exact speed and magnitude of future cuts, the Fed has been quite clear that they intend to continue cutting over the next 24+ months which (all else being equal) should lead to further gains in real estate values.
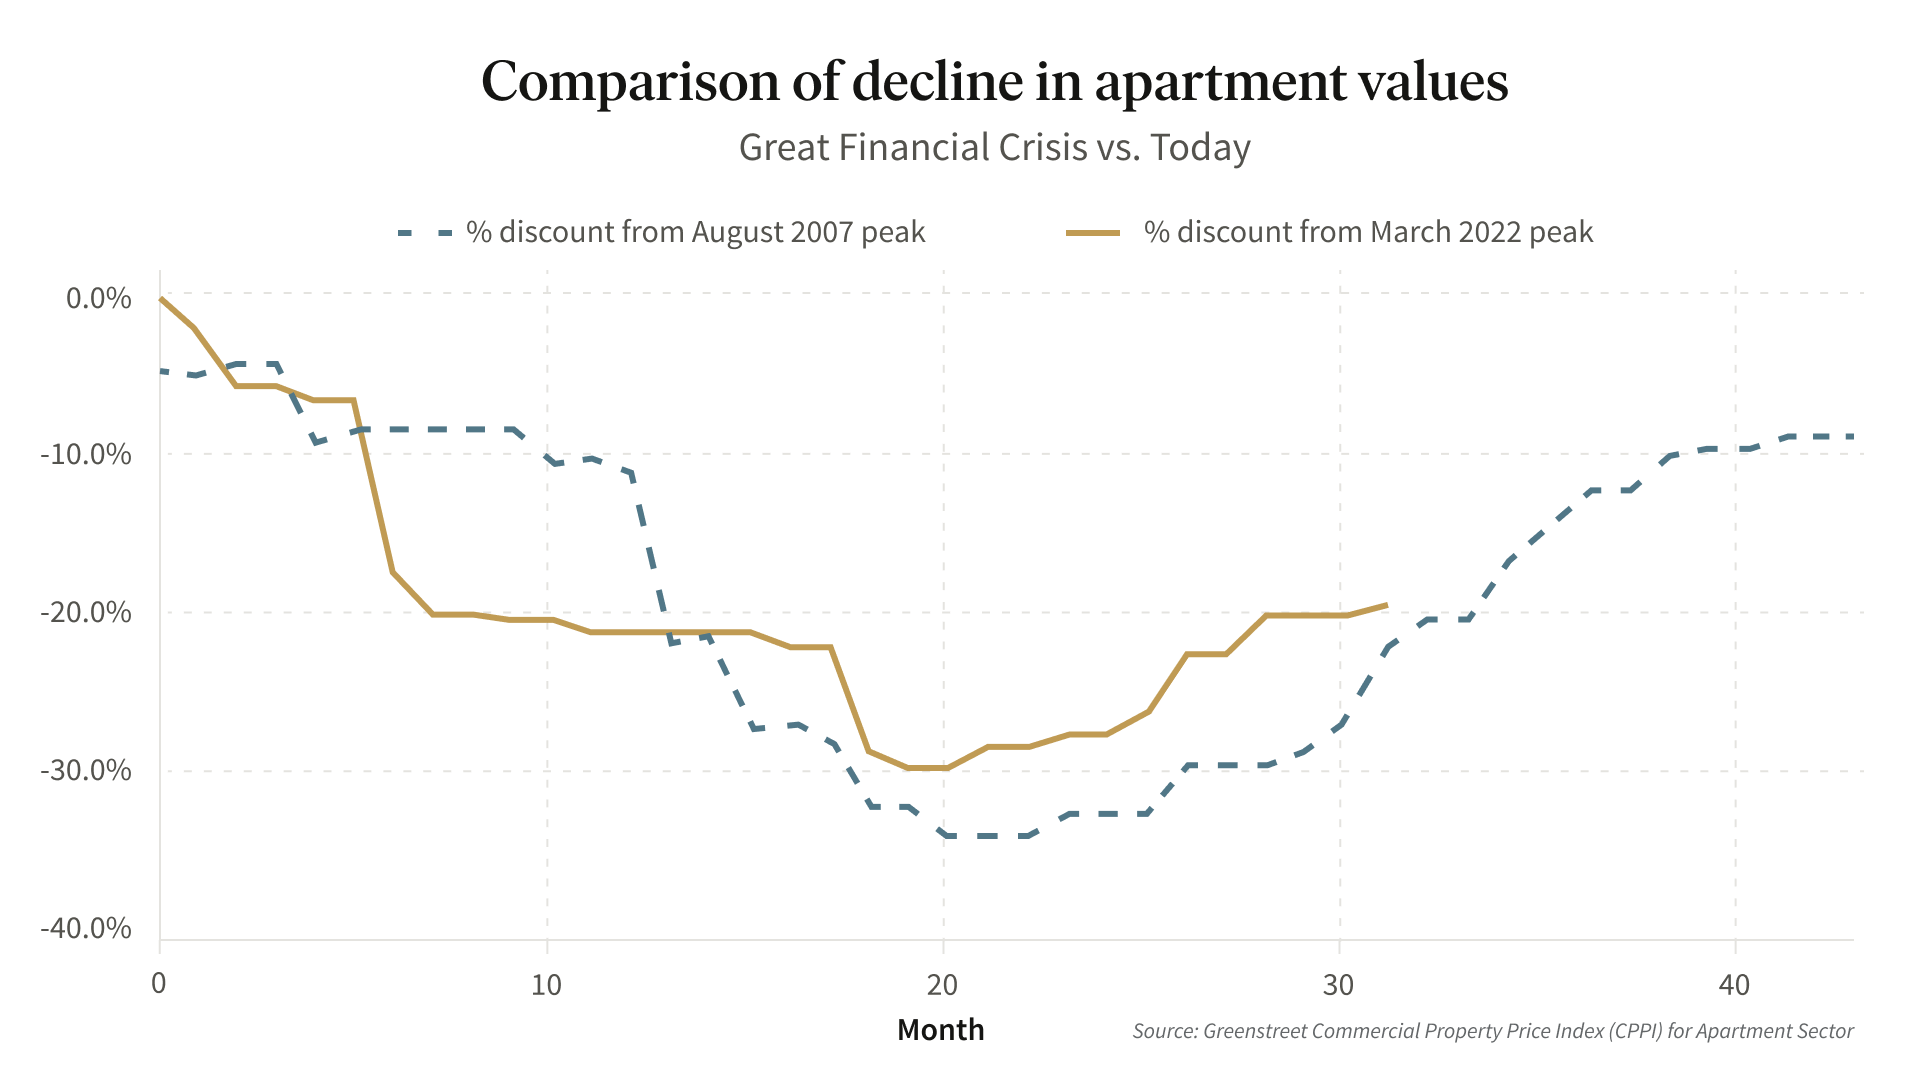
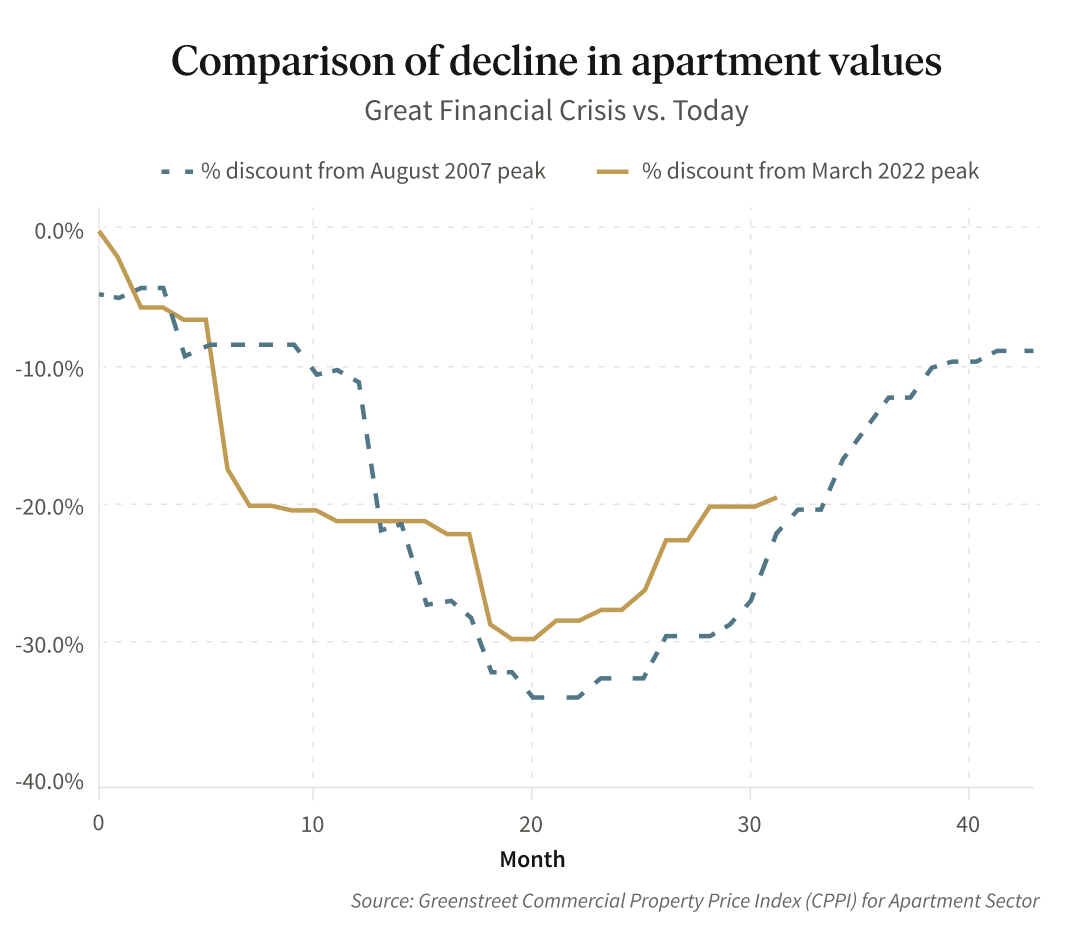
2. Prices for real estate are still at relative lows
Although stock prices are up 57% in the past 24 months, real estate prices are still relatively close to multi-decade lows — arguably at the most attractive pricing since the 2008 Great Financial Crisis. And it’s important to understand that this divergence is not common. In fact, for most of Fundrise’s history, real estate prices have moved more or less in step with the stock market. However, since 2022, stocks and real estate have taken very different paths. While there may be good reasons for this, in our experience, prices typically revert to the mean (i.e., the historical average), which makes real estate look particularly cheap today (and that much more interesting) especially when compared to the stock market.
As value investors, we focus less on trying to time the market and more on buying when prices look relatively attractive. Today, because of the negative impact of higher rates, values for multifamily and industrial assets are still significantly lower than at most every point over the past 10+ years.
We can’t guarantee when values will rise or exactly where interest rates will move, but we do believe that buying brand new assets, in well-located growth markets, at equal to (or even below) the cost it would take to build them today is generally going to lead to good results over a longer hold period.
Buying low and selling high is easy to say, but investing specifically after asset prices (and your own portfolio returns) have fallen is often the most difficult thing for many investors to do.
3. Oversupply has turned into undersupply
Supply and demand 101: Real estate values increase when there is more demand for the product than there is supply.
This means that when there are more people looking to rent apartments than there are apartments available, rents go up and property values go up.
In 2021 and 2022, borrowing costs were extremely low and pandemic-induced inflation drove up rents. The result was a record number of new apartment buildings being built, and a huge supply of new apartment units becoming available. This kept rents flat and hurt property values.
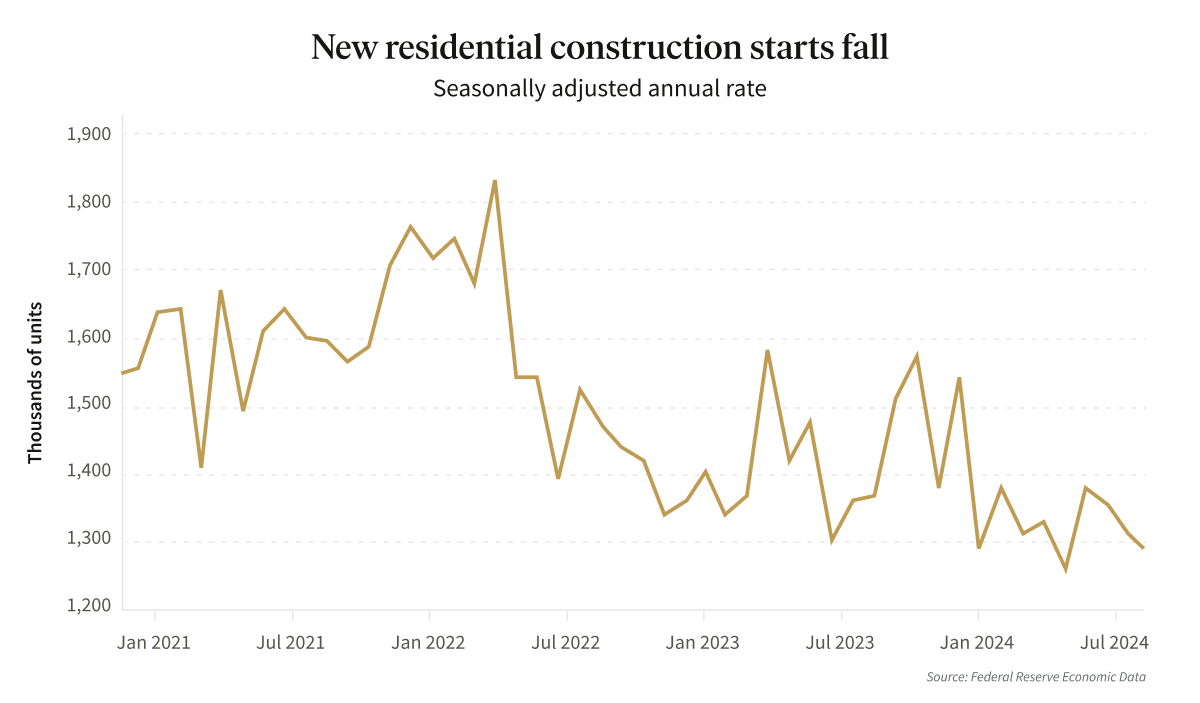
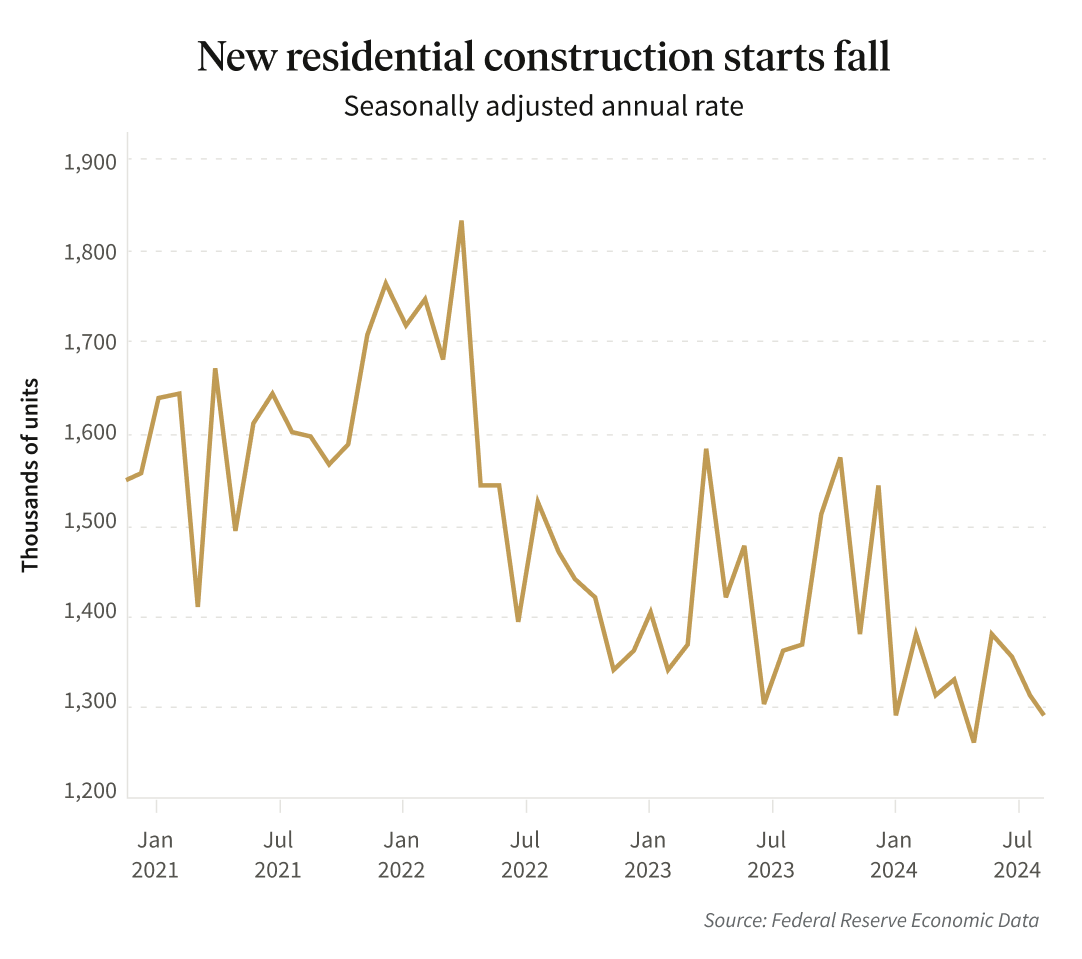
As interest rates rose, a second order consequence was that construction of new real estate properties, including new homes, apartments, and industrial buildings, fell to its lowest level in nearly a decade. This means that over the next several years the number of new residential units available will be falling while demand continues to rise, leading to higher expected rent growth and in turn (likely, in our opinion) higher values.
4. New administration policies may be accretive
While we tend to believe that mixing politics and investing does not result in better outcomes for our investors, we also recognize that changing administrations and changing policies will inevitably impact the economy.
We don’t have a crystal ball but we do expect a fairly significant change in the new administration’s policy positions which in turn is likely to impact investor’s portfolios.
This includes:
- deregulation of the financial sector (in particular, banks)
- the potential impact of tariffs
- reduced immigration
- lower potential taxes
In total, we think it is reasonable to assume that many relevant industries will see a more business-friendly environment with lower regulatory burdens, more liquidity in financial markets, but also higher costs around construction and new development. This dynamic has the potential to not only drive up investment demand but also further reduce future supply, compounding the existing supply constraints, resulting in even more appreciation in asset values.
No returns without risk
As we look out to next year, we see the potential for a series of factors to all move in favor of real estate values and private markets more broadly.
But as with all things when it comes to investing there is no guarantee and risk always exists.
We noted last year that 100% of economists predicted we would have a recession in 2023 and 100% were wrong. We were fairly certain that a soft-landing would be near impossible to achieve and the only thing that was different this time around was a longer lag between when rates started rising and the economy would begin to falter. Today, it looks as though we may have been wrong here too and the Fed may indeed pull off an economic feat which by most accounts hasn’t occurred since before WW2.
But to assume that risk has disappeared and future returns are guaranteed is exactly the type of mass delusion that itself often leads to a bubble.
The reality is that the stock market has been on one of its best short-term runs of all time, producing returns in the span of 24 months that more traditionally have taken close to a decade.
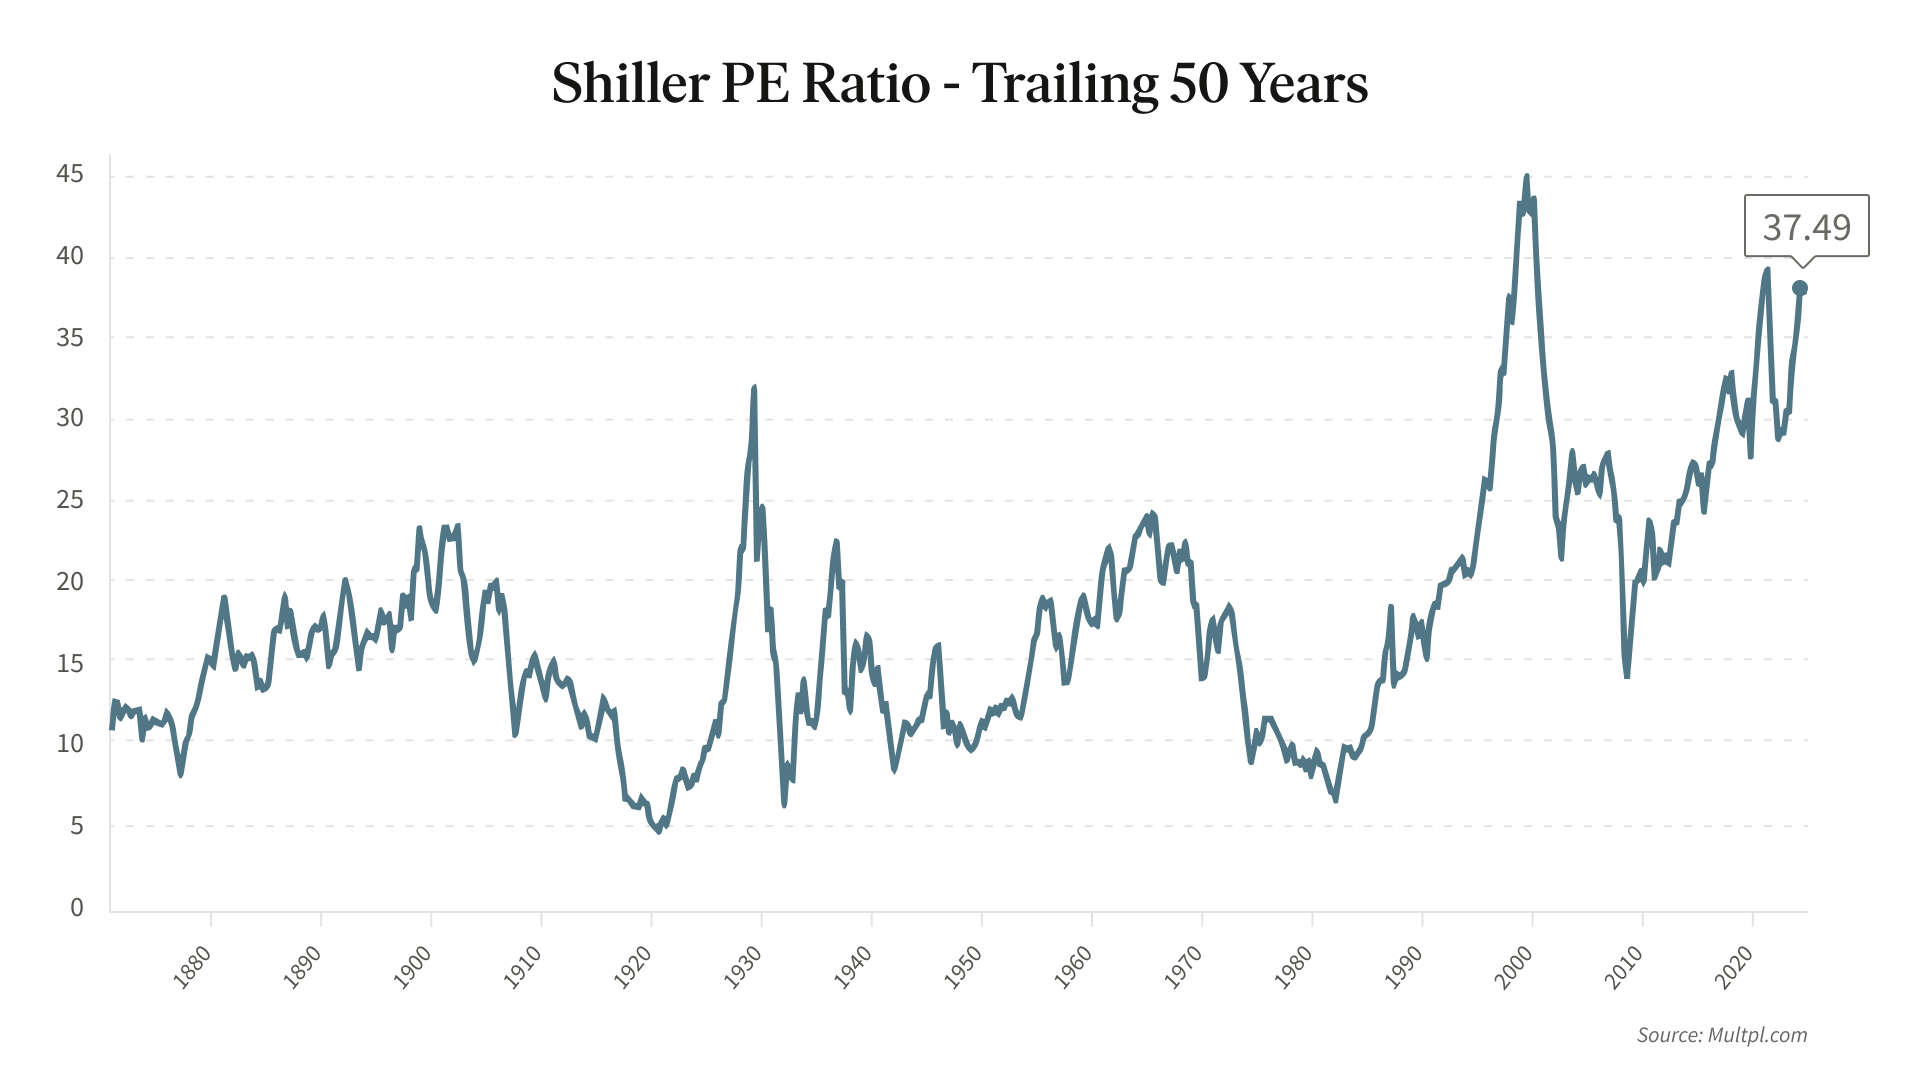
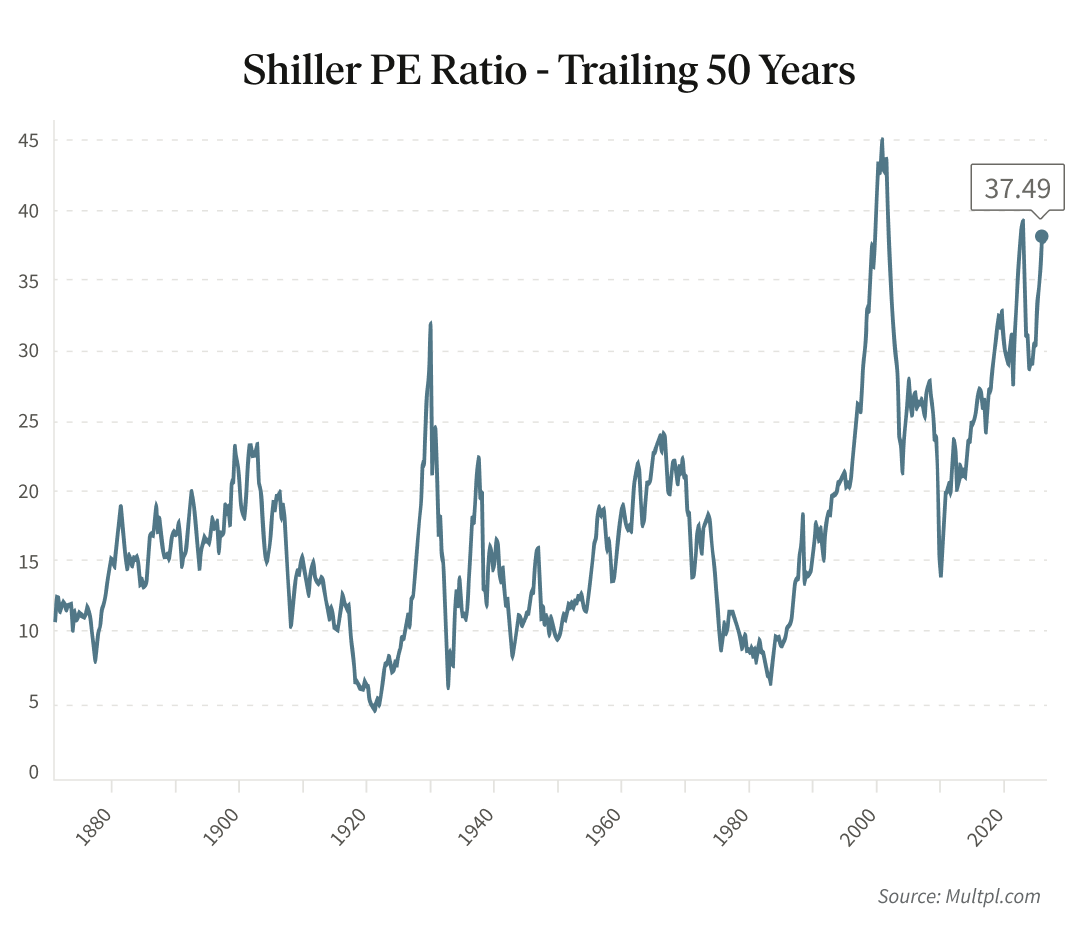
But it is also true that the market today is priced as high as it has ever been since the 2000 dot-com bubble (higher than leading up to the 2008 financial crisis and on par with the 2021 bull market). In fact, a number of market analysts, including Goldman Sachs, have forecasted that the S&P 500 may only return 3% annually over the next 10 years.2
Stock Market Potentially Overpriced
Contrastly, our confidence in the Fundrise portfolio stems largely from the fact that in many ways our assets have taken their punches — values of real estate have already been depressed — whereas stocks remain abnormally high.
And whether rates stay higher because of strong economic growth, or end up falling because the market is weaker than many assume, we believe that our real estate portfolio is likely to perform well in either scenario.
Again, as always, we advocate for a diversified, long-term approach. Having balanced exposure to well priced real estate, high fixed-income investments, and a portfolio of technology companies with the potential to realize outsized benefits from AI is, in our opinion, as sound a way as we know to position oneself today to both capture future potential upside while continuing to mitigate downside risk.
Going into the new year we want to thank our investors for their ongoing support, and look forward to the year ahead.
Onward!
Ben and the entire Fundrise team
| INVEST NOW |
—
As a reminder, please review your account settings and plan selections at least annually to ensure that your current selections continue to meet your financial goals. You can make any changes from the settings section of your account. If you have any questions, please visit our help center or reach out to our Investor Relations team at investments@fundrise.com.
Appendix
Exhibit A: 2024 net returns of advisory client accounts by individual Fundrise sponsored fund3
| Fund name / Objective | Average principal4 | Launch date | Net return |
|---|---|---|---|
| Registered Funds | |||
| Flagship Real Estate Fund | $1,138,956,578 | Jan 2021 | 7.47% |
| Income Real Estate Fund | $573,122,030 | Apr 2022 | 7.92% |
| Innovation Fund | $140,047,177 | Jul 2022 | 12.81% |
| Growth eREITs | |||
| Growth eREIT | $200,709,907 | Feb 2016 | 3.38% |
| Growth eREIT II | $124,581,586 | Sep 2018 | -2.58% |
| Development eREIT | $102,148,733 | Jun 2019 | -5.48% |
| Fundrise eFund | $75,477,779 | Jun 2017 | 1.65% |
| Growth eREIT III | $46,233,728 | Feb 2019 | 7.62% |
| Growth eREIT VII | $72,751,568 | Jan 2021 | 8.71% |
| Balanced eREITs | |||
| East Coast eREIT | $108,484,399 | Oct 2016 | -6.56% |
| Heartland eREIT | $70,520,593 | Oct 2016 | 4.72% |
| West Coast eREIT | $69,395,849 | Oct 2016 | 2.40% |
| Balanced eREIT II | $37,175,228 | Jan 2021 | 8.70% |
Exhibit B: 2024 net returns of all advisory client accounts of Fundrise Advisors by investment plan objective5
| Plan objective | Income | Balanced | Growth | Venture | Custom | Overall |
|---|---|---|---|---|---|---|
| Dividends | 4.17% | 1.95% | 1.15% | 1.56% | 2.51% | 2.05% |
| Appreciation | 2.39% | 4.07% | 3.71% | 7.05% | 3.74% | 3.70% |
| Net Total Return | 6.56% | 6.02% | 4.86% | 8.60% | 6.25% | 5.74% |
Exhibit C: Trailing 1-year and since inception cumulative returns of registered funds through December 31, 20241
| 1 year | Since inception | |
|---|---|---|
| Flagship Real Estate Fund | 7.50% | 20.24% |
| Income Real Estate Fund | 8.30% | 22.34% |
| Innovation Fund | 11.79% | 13.25% |