Like most in the tech world, we've been thinking a lot about AI. Not just its technical capabilities, but its economic potential. However, we’ve been unsatisfied with the existing analysis on that front. So we decided to dig into the numbers ourselves. What we found surprised us.
We spent months analyzing 40 years of financial data from over 250 tech companies, tracking the evolution from PCs to the cloud. Our goal was simple: understand the patterns of value creation in tech, and see what they might tell us about AI's future.
Some questions our research addresses:
- Is there a consistent relationship between Moore's Law and the market cap of each tech wave?
- Will the "Rule of 3" in market cap growth hold for AI?
- How is value distributed across the tech stack in each wave?
- What does Nvidia's explosive growth tell us about the future of AI?
--

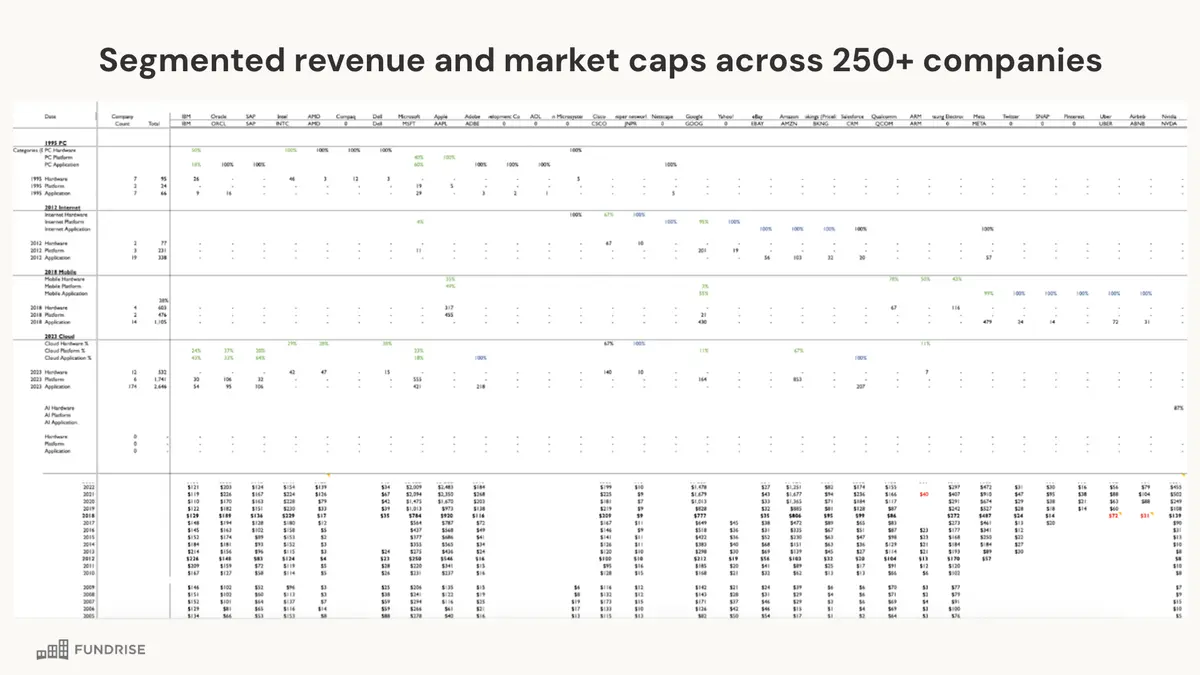
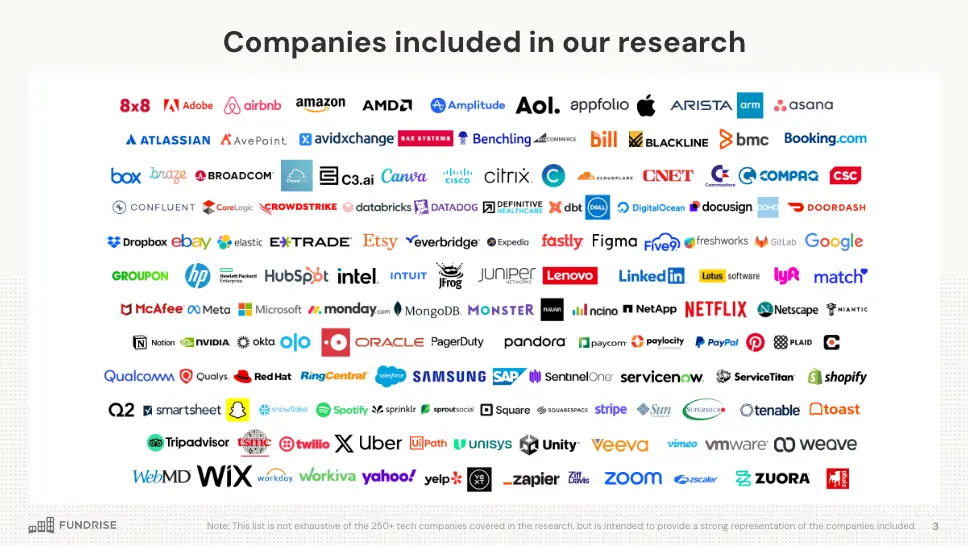
Let's begin with our methodology. We've undertaken an extensive financial analysis of the tech industry, spanning over four decades. Our sample is robust, encompassing more than 250 tech companies from the 1980s to 2024. To ensure relevance and significance, we focused largely on public companies with a minimum market capitalization of one billion dollars.
Our approach was meticulous. We captured the market capitalization of these companies on an annual basis. However, the real insight comes from how we attributed this value. We didn't just look at overall market cap; we drilled down into reported segment revenue for each technology wave and each layer of the tech stack. This granular approach allows us to trace the evolution of value creation across different technological paradigms.
Let me illustrate this with an example. Consider a tech giant like Microsoft. In the 1990s, Microsoft was a dominant force in both the PC platform with the windows operating system and application markets with the office suite. Fast forward to today, and they're a major player in the cloud platform with Azure and application markets with Microsoft 365. Our methodology takes this evolution into account. We applied their revenue breakdown between platform and application segments and allocated those percentages of their market cap to the specific waves and tech layers.
This approach allows us to not just see the overall growth of the tech industry, but to understand how value has shifted between different layers of the tech stack and across different technological waves. It's this in-depth understanding that forms the foundation of our analysis and projections for the AI era.
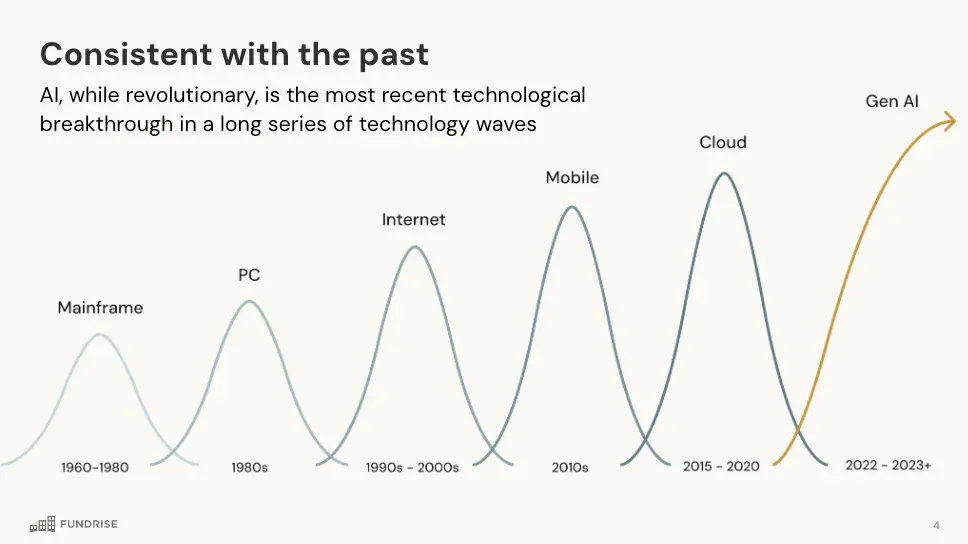
Now, let's pivot to the central theme of our presentation: Artificial Intelligence. There's no doubt that AI is revolutionary. It's reshaping industries, redefining possibilities, and capturing the imagination of technologists, investors, and the public alike. However, it's crucial to understand that while AI is unprecedented in its potential impact, it's not unprecedented as a phenomenon in the tech industry.
In fact, AI is the latest in a series of technological breakthroughs we've witnessed over the decades. Each of these breakthroughs – from personal computers to the internet, mobile technology to cloud computing – has ushered in a new era of innovation and value creation. By understanding the patterns of these past waves, we can gain valuable insights into the potential trajectory of AI.

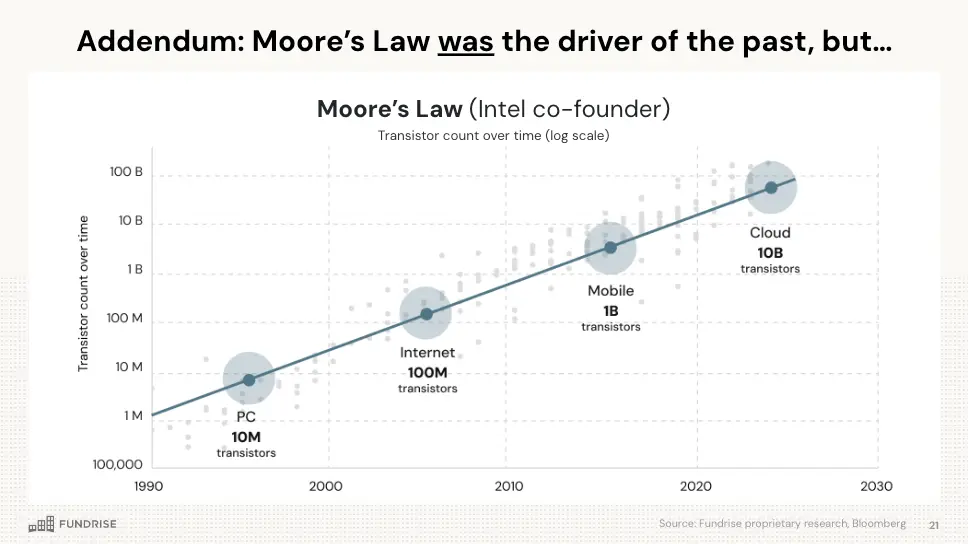
To truly appreciate the drivers behind these technological waves, we need to understand Moore's Law. This principle, named after Intel co-founder Gordon Moore, has been the fundamental driver of technological advancement for decades.
This graph illustrates Moore's Law in action. What you're seeing is the exponential increase in transistor count over time, plotted on a logarithmic scale. This relentless doubling of transistor density approximately every two years has led to exponential growth in computing power.
But here's the key insight: It's not just about the steady increase. What we've observed is that a roughly 10x increase in compute power typically unlocks a new innovation wave. This 10x leap creates a step-change in what's possible, opening up entirely new applications and markets.
This pattern has held remarkably consistent across multiple technological waves, and it's this consistency that forms the basis of our first key finding.


Our first key finding is both simple and profound: Each new technological wave results in roughly a 3x increase in market capitalization compared to the previous wave. This pattern has held remarkably consistent across the PC, Internet, Mobile, and Cloud waves.
Let's break this down:
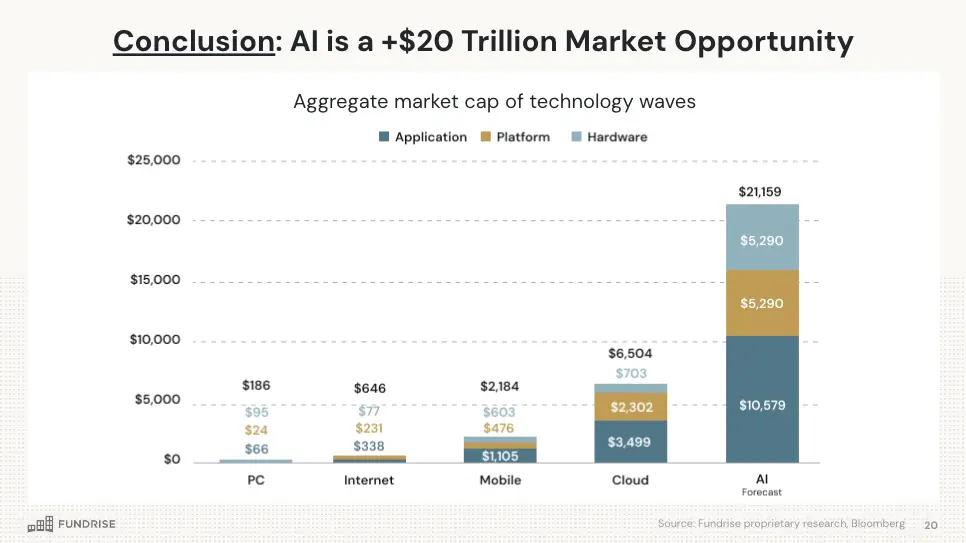
- The PC wave peaked at a market cap of about $186 billion.
- The Internet wave that followed reached about $646 billion – roughly 3.5 times the PC wave.
- The Mobile wave hit about $2.16 trillion – approximately 3.4 times the Internet wave.
- And the Cloud wave, which we're still in, is projected to reach about $6.5 trillion – 3 times the Mobile wave.
This consistency is striking. Despite the vast differences in the technologies involved, the use cases they enabled, and the time periods in which they occurred, we see this rule of roughly 3x growth holding steady.
We've playfully dubbed this observation the "Michael Moritz Corollary," in honor of the legendary venture capitalist, who took over Sequoia Capital from Don Valentine in the early 2000s. At the time, Moritz asked himself how he could possibly live up to the standards set by Valentine, who had been a seminal venture investor in Apple, Oracle, and Cisco.
Moritz’s intuition was that although the tech industry had achieved sensational scale over the previous few decades, Moore’s Law suggested that it would continue to grow even bigger in the future. Turns out he was right, making early investments in companies like Google, Yahoo, and PayPal.
Our financial research attempted to discover the quantitative support behind Moritz’s intuition.
To reiterate: we found each wave was about 3x bigger in market cap than the previous one. This isn't just a coincidence; it reflects fundamental dynamics in how technological progress translates into economic value.
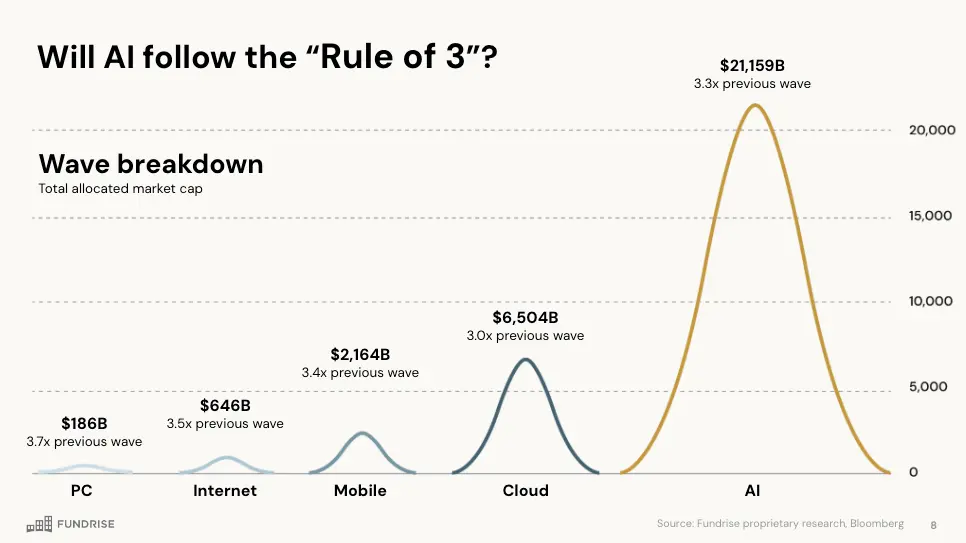
Now, we come to the trillion-dollar question: Will AI follow this "Rule of 3"?
If it does – and our analysis suggests there's good reason to believe it might – we could be looking at a potential market cap of over $21 trillion for the AI wave. That's 3.3 times our projected value for the Cloud wave at maturity.
I want to emphasize that this isn't just speculative number-crunching. This projection is grounded in the consistent pattern we've observed across four decades and multiple technological paradigms. Of course, past performance doesn't guarantee future results, but the consistency of this pattern across such diverse technological paradigms lends credence to its predictive power.
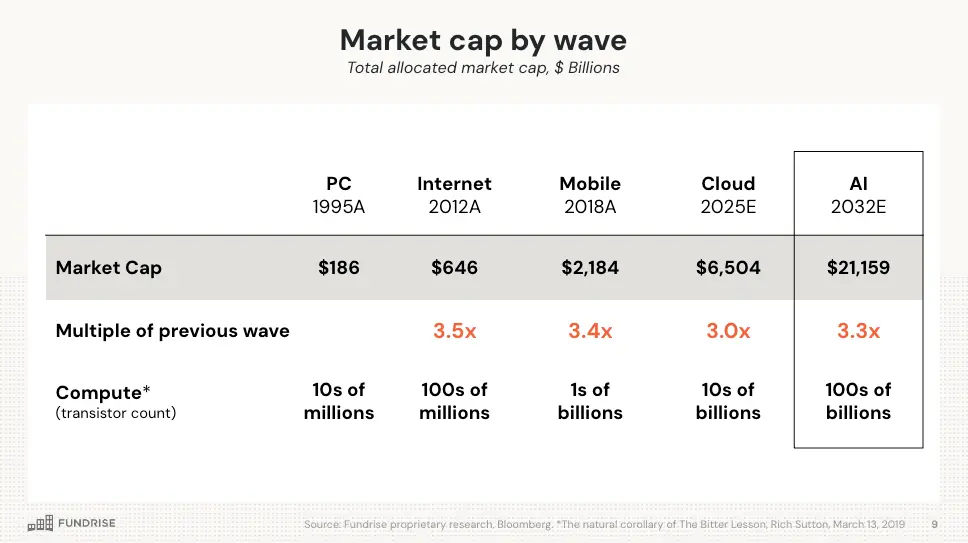
This slide provides a comprehensive view of the market cap progression across waves, from the PC era to our projected AI wave.
What's particularly interesting here is the correlation between each wave and the underlying compute power. Notice how each wave corresponds with an order of magnitude increase in compute power, measured in transistor count.
- The PC era was enabled by tens of millions of transistors.
- The Internet wave came with hundreds of millions.
- Mobile computing rode on the back of billions of transistors.
- The Cloud era is powered by tens of billions.
- And for AI? We're looking at hundreds of billions of transistors.
This alignment between compute power and market value isn't coincidental. It underscores how fundamental technological progress drives new possibilities, new markets, and ultimately, new value.
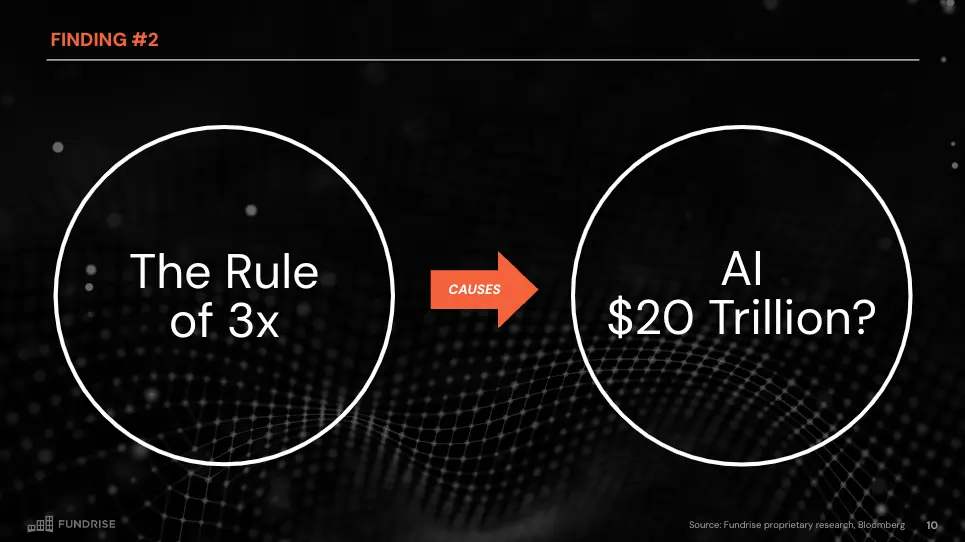
This brings us to our second key finding: Based on the Rule of 3x that we've observed consistently across previous waves, AI could indeed represent a $20 trillion market opportunity.
As a quick aside, one criticism of our conclusion will inevitably be that there are many other factors affecting market caps, and that in any year the market cap doesn’t correlate to the Rule of 3. During our 40-year survey, there were extreme booms and busts, such as the Tech Bubble in the late 1990s and the Great Financial Crisis in 2008. However, after each up or down period, market caps eventually reverted to the long-term mean and maintained correlation with Moore’s Law. As Ray Dalio argues, “it is better to be approximately right than precisely wrong.”
If the historic correlation holds up, we're talking about a market potentially half the size of the entire U.S. stock market. It's a staggering figure, so likely to attract skeptics. For some context, the cloud wave is worth ~$6 trillion which is ~10% of the current U.S. stock market’s $55 trillion. Our $20 trillion projection is in the early 2030s, and if the market grows at ~8% annually it’ll reach $100 trillion. So we’re talking about AI being roughly 20% the size of the total US market. Can AI double the opportunities for technology to add value in our lives? We think so.
This isn't just about the big number, though. It's about understanding the fundamental patterns of technology and what those are likely to mean for AI. Just as during previous waves, people couldn’t imagine how new technology would reshape the way we work, communicate, and live. Across each wave, technology expanded the role it plays in our lives.
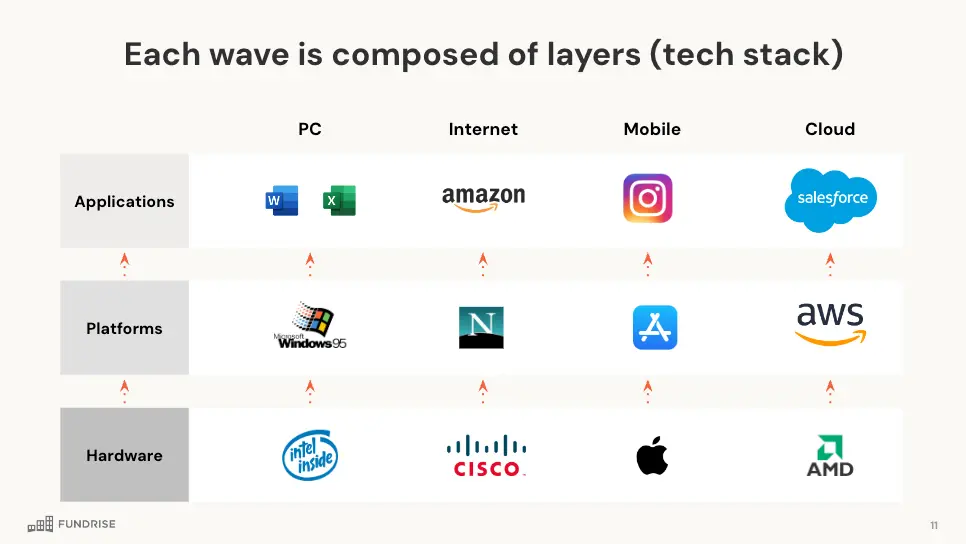
To truly understand how this value might be created and distributed, we need to look at the layers of the tech stack. Each technological wave we've studied is composed of three primary layers: hardware, platforms, and applications.

What's fascinating is that we've found a surprisingly regular ratio of market value within this stack across different waves. This consistency provides us with a framework for projecting how value might be distributed in the AI era.

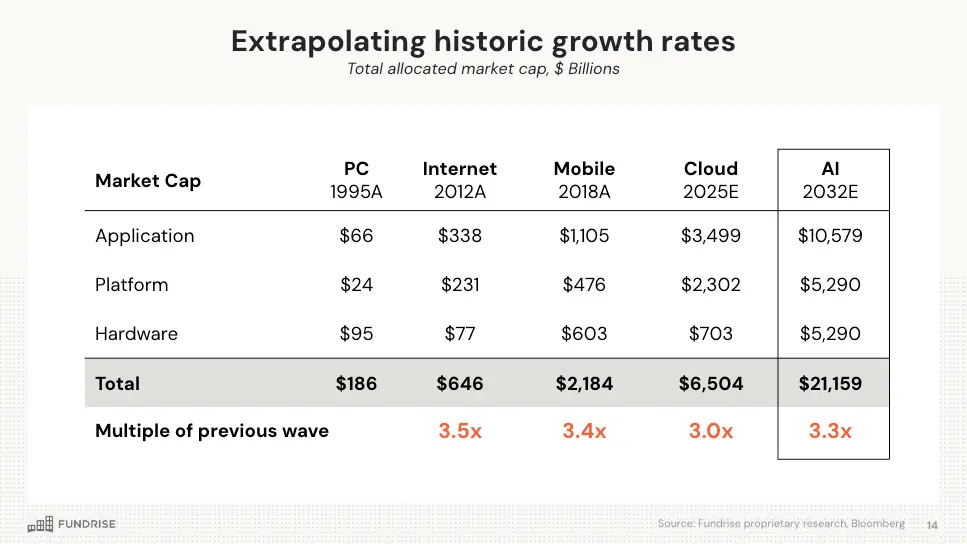
These slides provide a detailed breakdown of market cap by layer for each wave, and show how we've extrapolated this to project the AI wave.
Let's walk through this:
- In the PC era, hardware dominated, capturing 51% of the value. Platforms were just emerging, at 13%, while applications accounted for 36%.
- The Internet changed this dynamic. Platforms surged to 36% as search emerged as the central challenge of the internet, applications to 52%, while hardware fell to 12% facing commoditization.
- The Mobile wave saw hardware resurge to 28% with premium consumer smartphones like the iPhone, with platforms at 22% and applications leading at 51%.
- In the Cloud era, we're seeing platforms take the lead at 35%, applications at 54%, and hardware at 11%.
Based on these trends, for the AI wave, we're projecting applications to capture about 48% of the value, platforms about 26%, and hardware about 25%.
This breakdown isn't just about dividing up the pie. It gives us insight into where the key battlegrounds and opportunities might lie in the AI era.
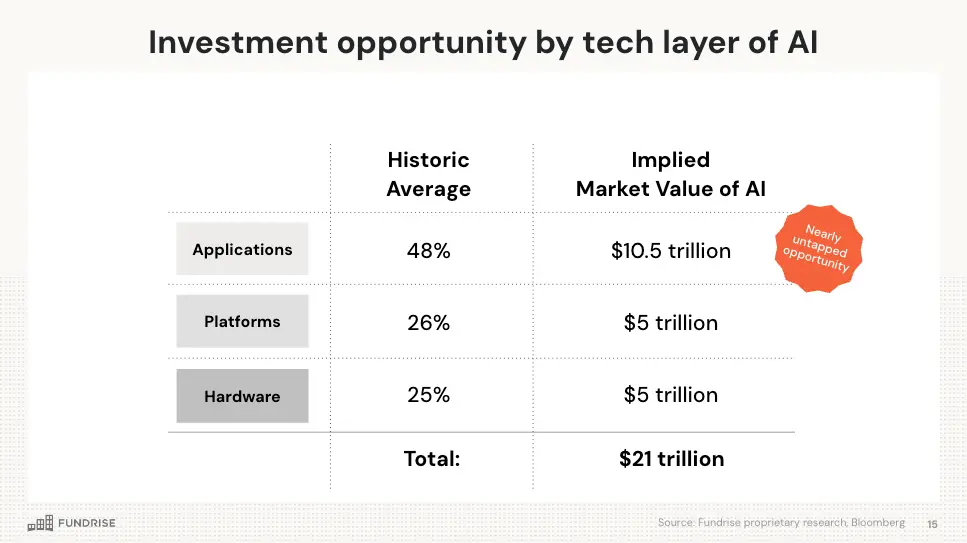
Translating these percentages into dollar figures really brings home the scale of the opportunity we're looking at.
- Applications could represent a massive $10.5 trillion opportunity. This includes AI-powered software, services, and solutions across every industry imaginable.
- Platforms – the tools and environments for building and deploying AI (exemplified by OpenAI and Anthropic) – could be a $5 trillion market.
- Hardware, including the specialized chips and infrastructure needed to train and run AI models, could also be a $5 trillion opportunity.
Each of these layers represents a market larger than many countries' entire economies. And importantly, they're deeply interconnected. Advances in one layer can unlock new possibilities in the others, creating a virtuous cycle of innovation and value creation.

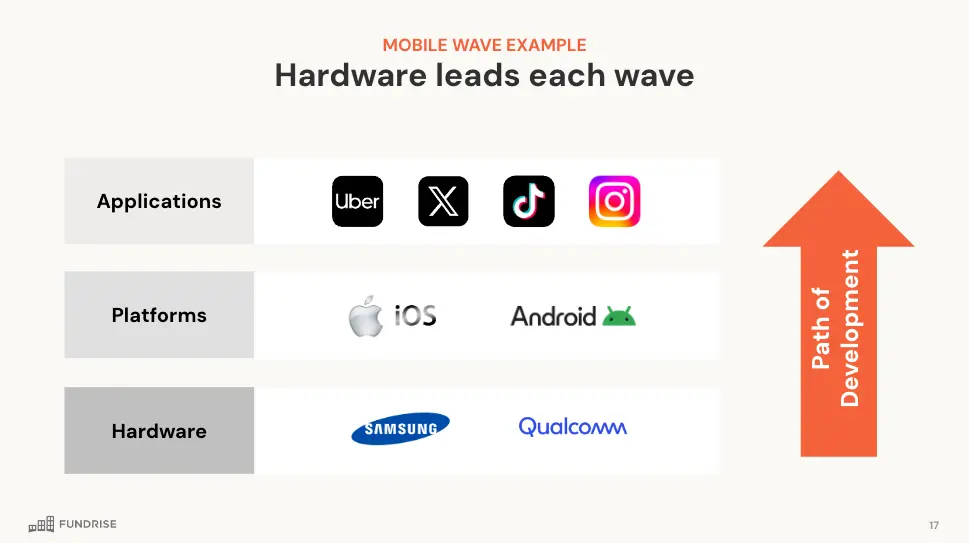
To ground this in a concrete example, let's look at how this played out in the Mobile wave.
In the Mobile era, hardware led the charge. Smartphones, with their advanced processors, screens, and sensors, were the foundation that made the mobile revolution possible. This aligns with our observation that hardware often leads each wave, creating the fundamental capabilities that platforms and applications then build upon.
Platforms followed, with iOS and Android creating the environments for mobile innovation. Finally, applications exploded, from social media apps to mobile commerce platforms, creating the bulk of the user-facing value. For instance, the iPhone was introduced in 2007, but Instagram was not founded until 2010.
This pattern of development – progressing from hardware to platforms to applications – has been consistent across waves, and we expect it to hold true for AI as well.
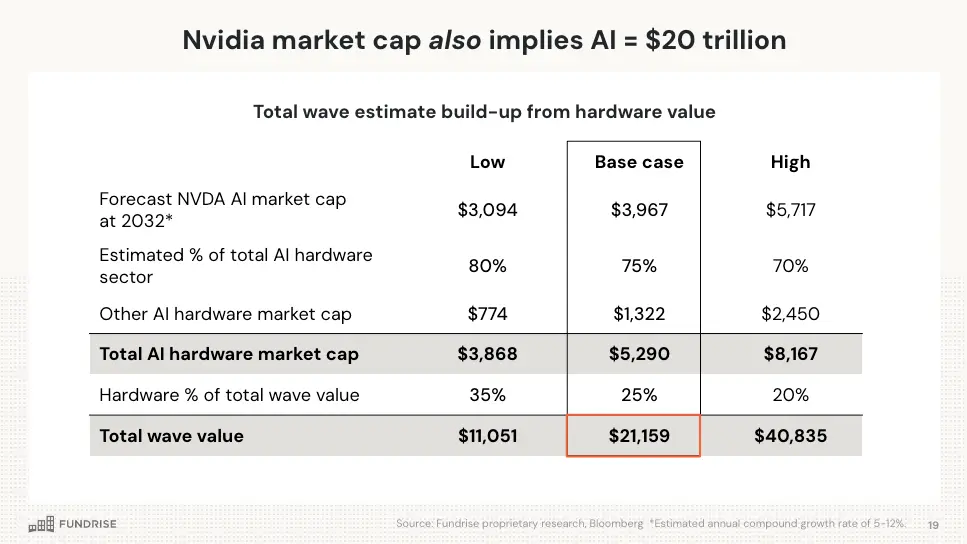
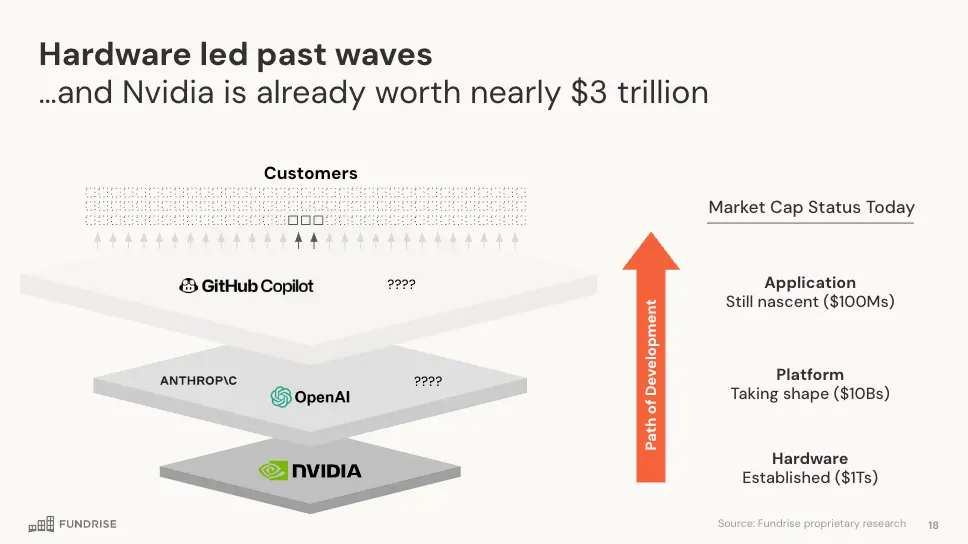
Speaking of hardware leading the charge, let's talk about Nvidia. Their current market cap of nearly $3 trillion is not just impressive in its own right – it also provides a fascinating cross-check on our AI market projections.
If we assume Nvidia captures 75% of the AI hardware market (our base case scenario), their current valuation implies a total AI hardware market of about $5.3 trillion. This aligns remarkably well with our projection based on historical patterns.
Furthermore, if hardware represents about 25% of the total AI wave value (consistent with historical averages), this would indeed point to a total AI market of around $21 trillion.
Of course, these are projections and assumptions, but the alignment between these different approaches to valuation provides additional confidence in our overall thesis.
In conclusion, our analysis suggests that AI represents a $20+ trillion market opportunity. This figure is immense, but it's grounded in the consistent patterns we've observed across previous technology waves.
This isn't about predicting precisely what is going to happen though. It's about understanding “what’s past is prologue.” AI has the potential to reshape every industry, every job, every aspect of how we think about the world. The value creation we're projecting is a reflection of that fundamental, economy-wide transformation.

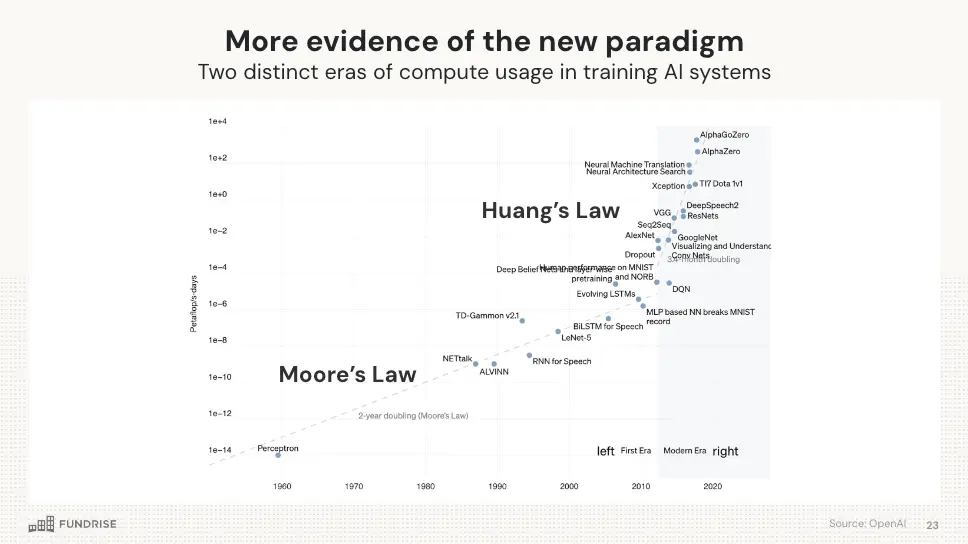

Before we wrap up, I want to touch on an important addendum to our analysis. While Moore's Law has been the driver of past waves, we're seeing evidence of a new paradigm that could accelerate growth even further.
Nvidia, under the leadership of Jensen Huang, is growing compute power twice as fast as Moore's Law predicted. This "Huang's Law" could lead to even more dramatic market cap increases in the AI wave than our model predicts.
Consider this: If market cap historically increased 3x for every 10x in compute power under Moore's Law, what happens when compute power is growing 20x in the same timeframe? We could be looking at a 6x increase in market cap.
This is speculative, of course, but it underscores the potential for the AI wave to surpass even our bullish projections. We're entering uncharted territory, where the pace of innovation could accelerate beyond anything we've seen before.
