People outside of the real estate investment industry may be unaware, but the market is currently navigating a period of turbulence comparable to what it experienced during the 2008 financial crisis, with cap rates and pricing down as much as 50%. In this episode of Onward, co-hosts Ben and Cardiff look at some behind-the-scenes market data that Ben has been analyzing, thanks to his on-the-ground insights through managing the Fundrise portfolio.
As Ben explains, the industry’s trouble isn’t just a matter of property values dropping and financing becoming prohibitively expensive, after over a year and a half of interest rates ratcheting higher and higher. Even more concerning is just how startlingly uneven the market has become, with investment property values severely misaligned with the values attached to properties purchased and sold by individual homebuyers.
In order to understand these differences, our hosts point out, we need to look at more than just completed transactions and sales prices — we also need to consider the numbers behind offers that are not being completed, to see why sellers are not willing to accept the low prices that current buyers are willing to pay. And in order to see those kinds of bids, you need to be directly involved in the market’s dynamics — a perspective Ben can fortunately share.
As a supplement to the episode, here’s a closer look at a couple of the comps that Ben talks through in the episode, helping to bring home the severity of the market’s current fracture:
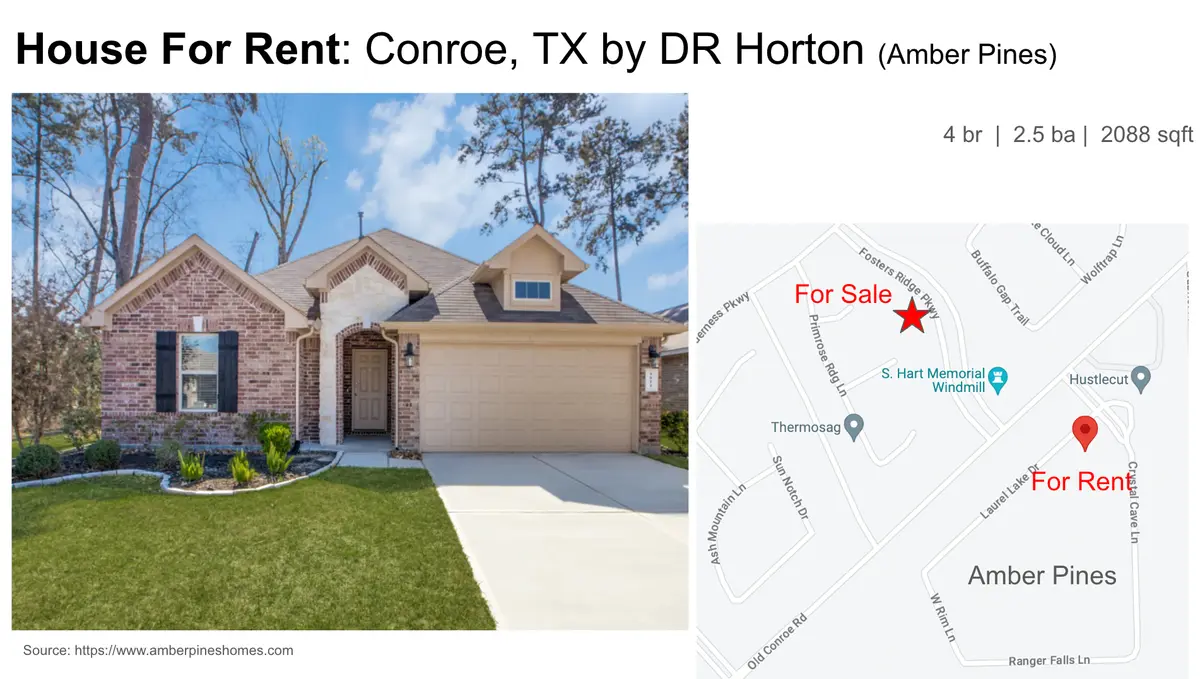
First, Ben discusses Amber Pines, a 124-unit rental home community in Conroe, TX, near Houston, that the Fundrise portfolio acquired in late 2020, for a cost of roughly $256,000 per home.
Today, about 1,000 feet from Amber Pines, the homebuilder DR Horton is marketing homes nearly identical to the community’s homes — this one for roughly $390,000.
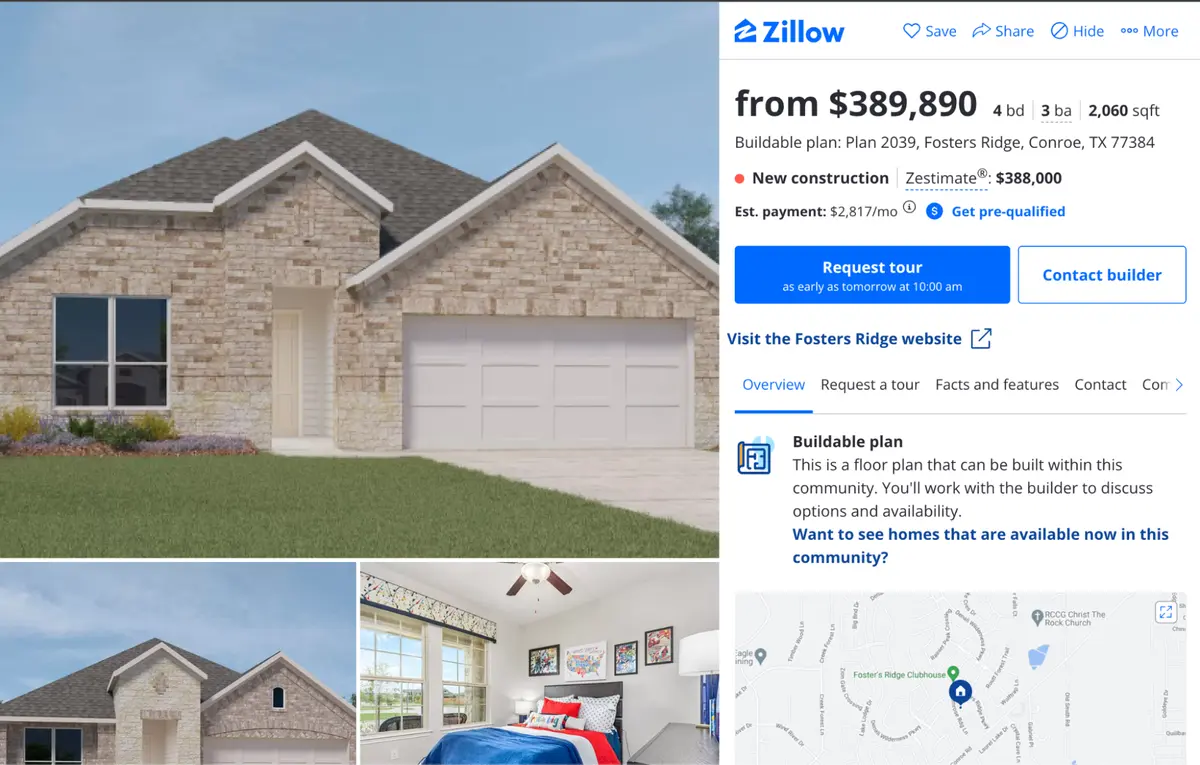
Meanwhile, in testing current market demand, Fundrise has found that a similar home in Amber Pines has purchase offers from real estate investors for as low as $220,000 — 40% less than the for-sale home, nearly identical in quality and location.
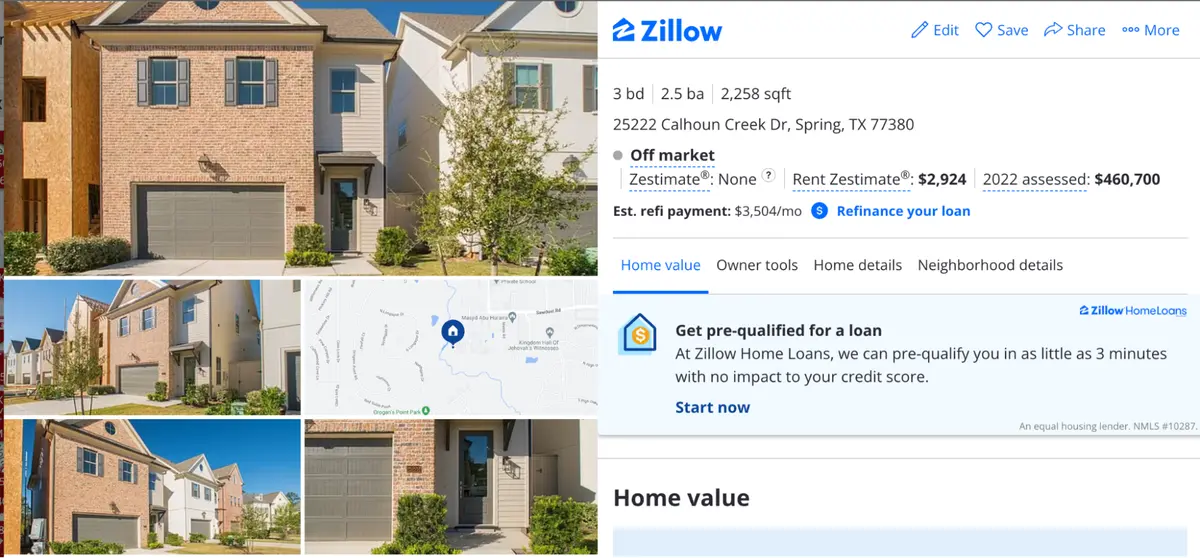
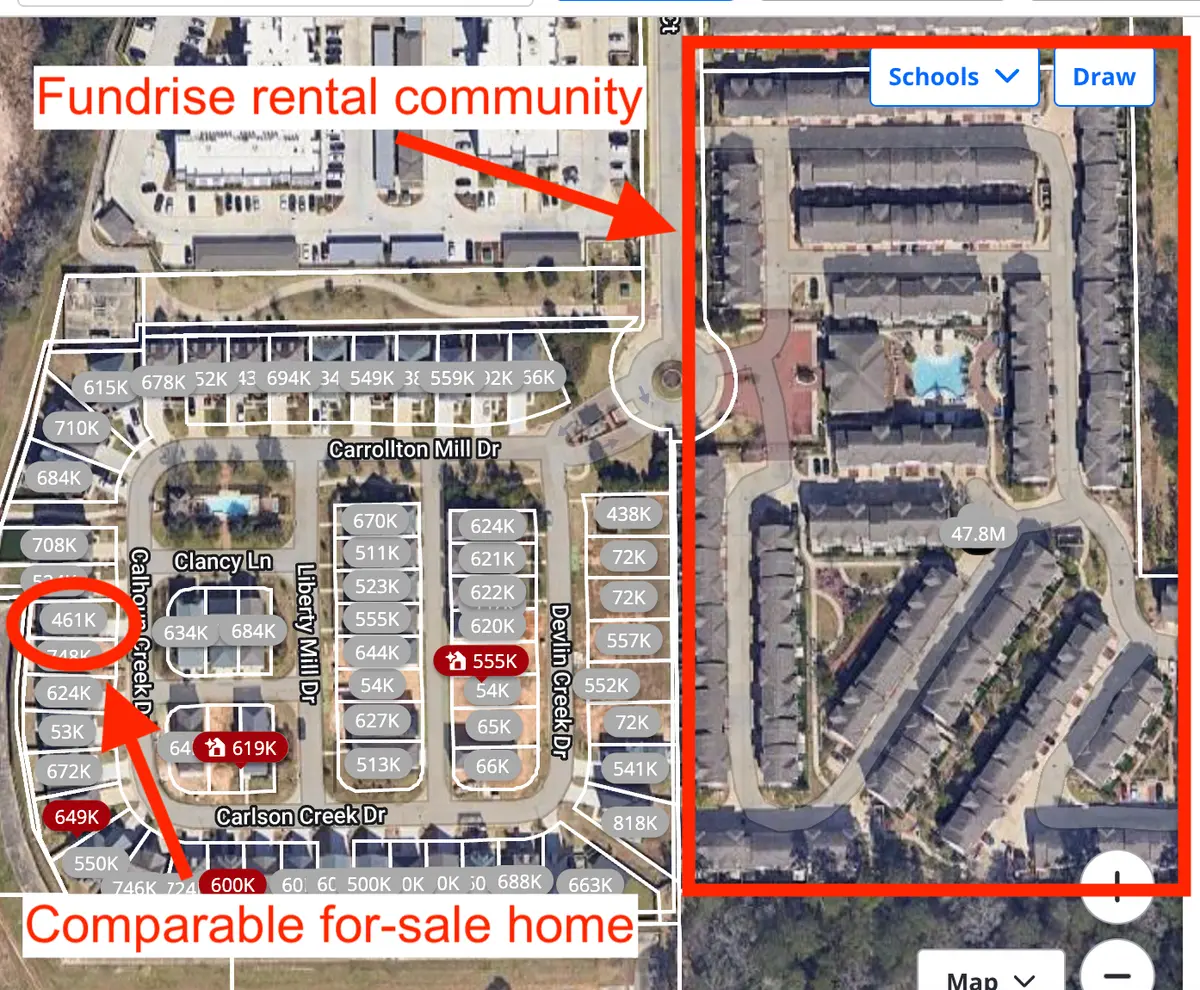
Similarly, in The Woodlands, TX, the Fundrise portfolio holds a community of 171 rental units purchased in 2021; over the last two years, the community’s net operating income has increased by 27%, driven largely by inflation.
However, purchase prices are behaving abnormally: In the cluster of for-sale homes immediately next door, the lowest priced comp has been assessed at $461,000 (while other homes in the neighborhood are even priced at +$700,000).
But during a marketing process of the adjacent rental community for sale, the homes have received offers from real estate investors for as low as $236,000 a house, 50% lower, despite being virtually identical in quality and location.
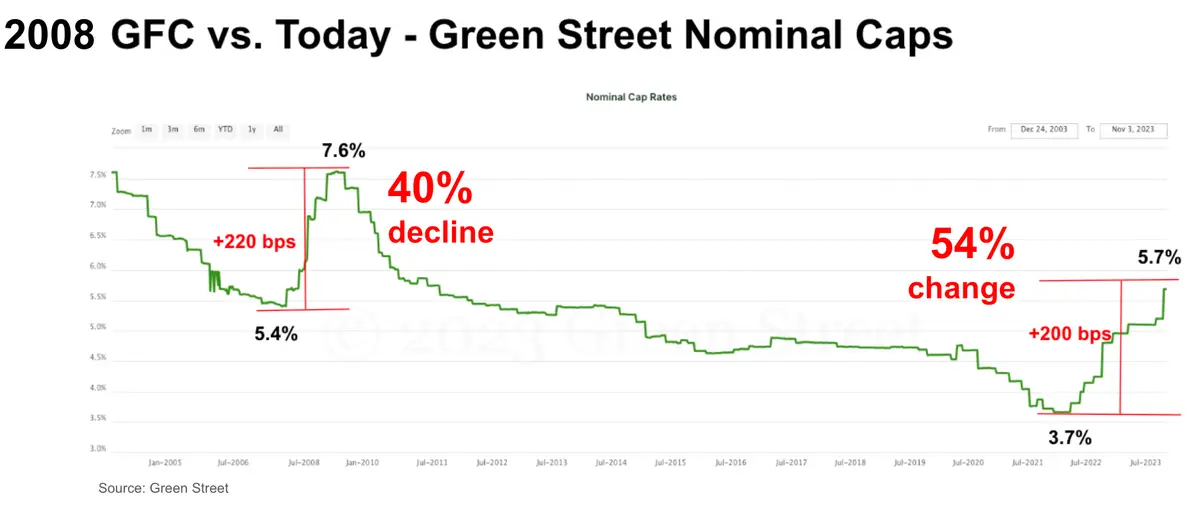
The change in value is largely driven by interest rates, with the price of a 30-year Treasury falling 25% from August to October (from about 4% to 5%). Real estate prices lag but are highly correlated with interest rates, and both are priced in yield. If yields rise, prices fall. The rapid rise in yields have had an acute impact on property prices. Below is a breakdown from Green Street, a premier institutional real estate research firm, showing how yields this year have moved about as much as during the 2008 Financial Crisis.
The chart shows these effects haven’t been unique to the Fundrise portfolio — in fact, when compared against the entire investment real estate market, Fundrise’s portfolio continues to significantly outperform comparable investments, specifically Vanguard’s Real Estate ETF, the single best point of reference for the real estate investment space. When compared since the start of 2020, Fundrise’s all-client portfolio continues to handily beat the VNQ by over 31%, with a total return across all Fundrise clients of over 27.17%, while VNQ sits at approximately -4%, representing the struggles the entire sector has faced over the last several years.
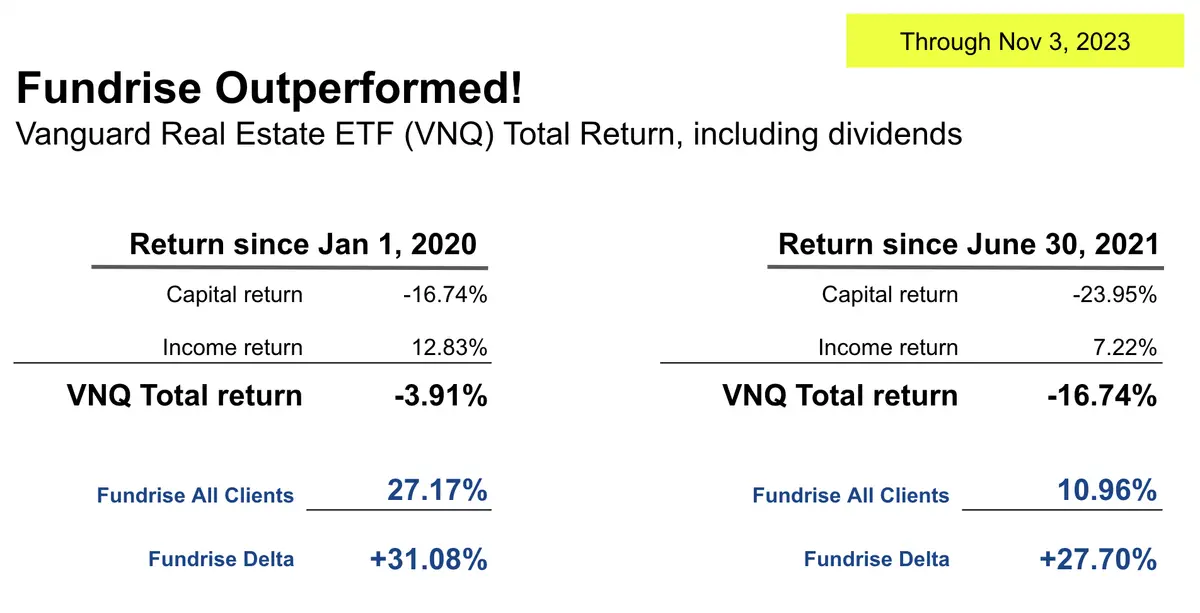
Even so, with industry-wide headwinds and the broken market Ben describes, even the Fundrise portfolio, with its considerable defensive positioning, has been affected.
Ultimately, this episode of Onward is an important look at how the investment real estate market has reached a puzzling juncture, as it makes its way through its largest upheaval in 15 years. As always, great change opens the door to great opportunity — but what else does the current state of investment real estate mean for the economy, writ large?
Will interest rates continue at their present level, despite the rupture in the bond markets and continued challenges for banks? When and how will the impact on the real estate industry make its way to other sectors? Why exactly is the market broken — and what will it take to fix it?
All this and more, on the latest episode of Onward.
- Listen on Apple Podcasts >>
- Listen on Spotify >> (or wherever you get your podcasts)
- Read a Transcript >>
