Portfolio Stress Test
Published April 3 to accompany a letter to investors on the coronavirus (COVID-19) pandemic
Under normal market conditions, we review the position of each asset in the Fundrise portfolio on a periodic basis. Given the extreme uncertainty caused by the ongoing COVID-19 pandemic, we decided to conduct an additional severe “stress test” analysis of the entire portfolio in which we assumed extreme adversity in the real estate market with the intention of providing investors further transparency into what we believe is the relative overall strength of the Fundrise portfolio to withstand such a scenario.
In this overview, we will cover the assumptions that were generally applied to create a “stressed” scenario. For reference, where appropriate measurements are applicable and the historical data exists, we used assumptions that were more severe than what occurred to similar types of assets during the 2008 Great Recession. The result, we believe, is an extreme downside scenario which we remain hopeful will not ultimately come to pass.
Below is a summary of key results from the analysis:
- More than 82% of the portfolio is invested in residential assets, including rental apartments and senior loans on properties intended for residential use. We believe residential real estate is one of the most defensive asset types to own in this crisis; since shelter, like food, is a basic need.
- Our equity ownership positions in rental apartments are relatively low-leveraged with fixed-rate loans. The average loan-to-value (LTV) on these assets is approximately 60%.
- The portfolio of senior loans, both acquisition and construction loans, are held on balance sheet with no additional leverage and are secured by the underlying property. In virtually every case, these assets are located in urban infill locations.
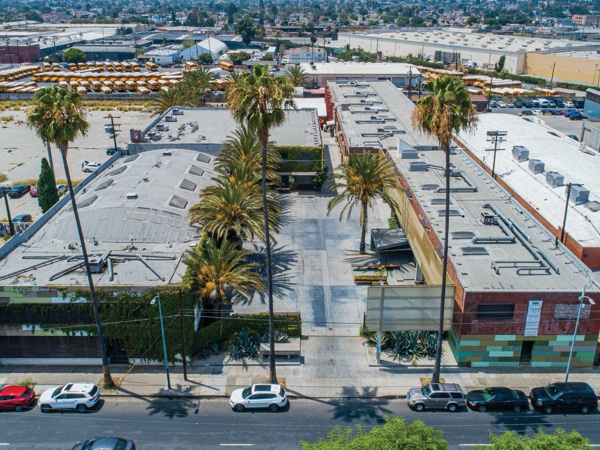
- Properties that are either currently under development or expected to begin development soon represent 12% of the total portfolio and are owned without any senior debt.
- Commercial and mixed-use real estate makes up only 6% of the total portfolio and is moderately leveraged with an average of loan-to-value (LTV) of 50 - 55%.


*In the stress test scenario, some assets may experience temporary dips in value or periods of lost income,which we believe would rebound over the full lifecycle of the investment. However, there can be no guarantee that the conditions created by the ongoing COVID-19 global pandemic, or any other future unforeseen event, will not result in greater stress on the assets than is demonstrated here.
| Investment type and structure | Value | % of total | Stress metric | Stress grade |
|---|---|---|---|---|
| Equity ownership of real estate | Debt coverage (DSCR) | |||
| Apartments - stabilized | $285.6M | 26.0% | 1.87 | |
| Commercial / mixed-use - stabilized | $52.6M | 4.8% | 3.99 | |
| Commercial / mixed-use - development | $98.2M | 8.9% | No debt | |
| Single family homes - rental & for-sale | $49.0M | 4.5% | No debt | |
| Miscellaneous equity | $3.4M | 0.3% | ||
| All equity investments | $488.7M | 44.5% | ||
| Fixed-income real estate investments | Loan to value (LTV) | |||
| Apartments - stabilized (preferred structure) | $207.9M | 18.9% | 82.5% | |
| Apartments - development (preferred structure) | $69.3M | 6.3% | 68.9% | |
| Senior construction or bridge loans | $152.8M | 13.9% | 71.5% | |
| Miscellaneous (preferred structure) | $5.3M | 0.5% | 61.5% | |
| All fixed-income investments | $435.3M | 39.6% | 76.2% | |
| Liquid investments | ||||
| Cash & government money market funds | $175.0M | 15.9% | — | |
| Overall Fundrise portfolio | $1.1B | 100% | ||
Equity ownership of real estate
Primary stress metric: debt service coverage ratio (DSCR)
Debt service coverage ratio (DSCR) is a metric that expresses how much income the property generates relative to the required debt payments. A DSCR of 1.0 means that the property generates enough income to pay debt service, and the higher the DSCR number, the greater the margin of safety. For example, a property with $125,000 of income and $100,000 of debt service each year would have a DSCR of 1.25. The DSCR also allows you to determine the relative drop in income that would have to occur before the property would risk not being able to meet its debt service requirements. In the prior example, the income from the property would have to fall by more than 20% before the DSCR dropped below 1.0.
In addition, many of the equity investments are owned outright, i.e., with no debt. In such cases, the risk of losing the property due to foreclosure (one of the primary ways that real estate investors risk losing principal during a financial crisis) is essentially non-existent since there is no lender.
Typical business plan
The Fundrise stabilized apartment strategy is focused on providing well-located and reasonably priced housing for workforce renters. These types of assets have generally better withstood past downturns, as people tend to downsize to more affordable housing during times of economic hardship.
How we stress tested it
We stress tested the operating cash flow by assuming the current coronavirus crisis causes average economic vacancy/loss factor to increase to approximately 32% for a period of 12 months, which would include actual vacancy as well as potential lost income from tenants who miss rent payments.
For context, an economic vacancy / loss factor of 32% is nearly 5 times higher than the existing economic vacancy / loss factor for the portfolio, which has been about 7%, on average, as of Q1 2020. It is also nearly 3 times higher than the peak vacancy nationwide in Q1 2009 of 11.1% during the Great Recession, per data from the Federal Reserve. Since 1956 when Federal Reserve data begins tracking, the average apartment vacancy nationwide has ranged from about 5% to 11%. In other words, we believe that a 32% economic vacancy is an extremely severe stress test.

We used the following definitions in our calculations:
Operating Cash Flow = Gross Income - Total Expenses - Debt Service (i.e, we included a replacement reserve assumption ranging between $250 - 300 / unit / year depending on vintage and used the most recently available trailing 12-month (T-12) figures (annualizing for some assets w/ less than 12 months of operations))
Gross Income = Gross Rent + Other Income - Economic Vacancy (which was applied to Other Income as well as Rental Income)
- 1a. Under the stress test scenario, it is projected that several stabilized apartment properties would have their DSCR fall below 1.0. In such circumstances, we project that these properties would require a total additional investment of roughly $1,500,000 in cash reserves to cover their collective debt service over the entire 12 month period.
- 1b. As Manager, we chose not to place any debt on these small-balance apartments.
Typical business plan
The Fundrise mixed-use development strategy is focused on acquiring well-located but underutilized properties in core urban infill locations, particularly in clusters or portfolios that allow us to achieve a critical mass. These properties are intended to be developed over a long-term horizon and aim to meet the growing demand for both residential and commercial uses in large cities. These types of assets typically generate little to no cash-flow in the near term but benefit from long-term appreciation potential due to the highly supply-constrained nature of most urban markets.
How we stress tested it
We chose to not place any debt on the assets the funds own directly that are either in development or that we intend to begin development on in the near future. As a result, there is little to no risk of loss from a property lender. Most projects are recently acquired and in pre-development. Any cash reserves required are for the permitting, architectural work, and other soft costs to be spent as the projects progress through the entitlement/zoning process. Also, historically, during a recession, local governments have typically been more supportive of development, and construction costs tend to be much lower, both of which would potentially be beneficial to the business plan for these types of investments.
Due to the relatively unique aspects of each of these properties, we stress tested them on an individual basis as detailed in the footnotes.
- 2a. The stress test assumes that extreme social distancing and/or the lockdown is required for 12 months and no retail tenants pay their rent for the entire 12 months. The result is a projected shortfall on the annual debt service which is paid by the fund.
- 2b. The property is leased to the US Postal Service, which the stress test assumes continues to pay rent in full.
- 2c. The stress test assumes that extreme social distancing and/or the lockdown is required for 12 months and no retail tenants pay their rent for the entire 12 months except for those tenants that are considered essential services and the tenants with corporate credit. Stress test also assumes that 20% of the office tenants do not pay rent, and there is no parking revenue for that period.
- 2d. Property has no debt and is leased to Beacon Roofing Supply, Inc. (NASDAQ: BECN), which the stress test assumes continues to pay rent in full.
Typical business plan
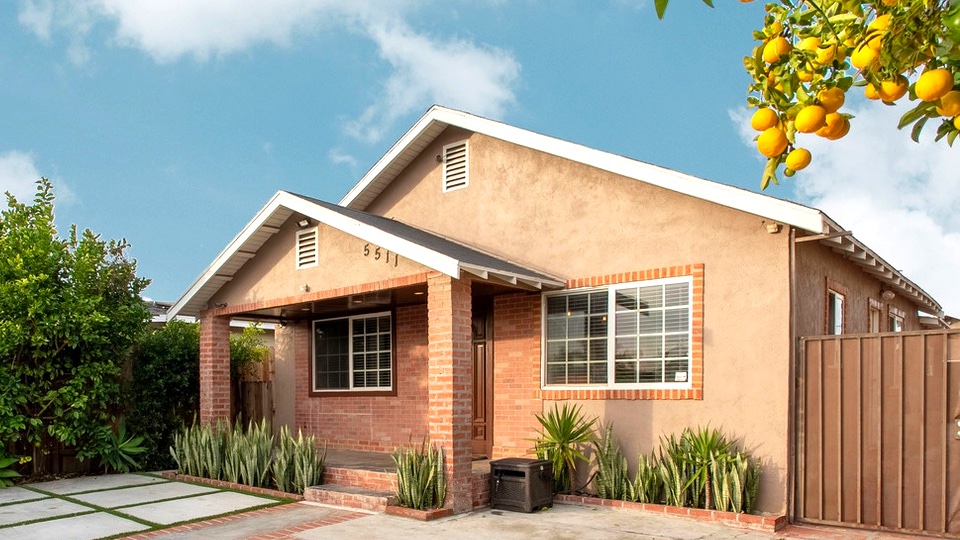
The Fundrise single-family home rental and for-sale strategies are both focused on capitalizing on the undersupply of relatively affordable single family homes in major urban markets such as Washington, DC and Los Angeles. As millennials continue to age out of apartments and begin to start families, we believe, once the current COVID-19 crisis has passed, the demand for these types of “starter homes” will continue to increase overtime. The Fundrise rental strategy aims to provide these homes for rent with the long-term upside of either renovating or selling, while the Fundrise for-sale strategy is focused on renovating and providing the homes for sale in the near term. While to date rising construction costs have been detrimental to the home renovation business, once the country is through the current crisis, potentially lower mortgage rates and the desire to move out of an apartment into a home may create unexpectedly higher demand for new homes.
How we stress tested it
None of the homes carries any property debt. As a result, there is little to no risk of loss from a property lender. Any cash reserves required are for limited ongoing development or home renovations. The majority of current rental vacancy is as a result of homes under renovation that have not been put on the market for lease up. We assumed all homes would continue to be held through the 12 month period and that any relative near term decrease in value would ultimately revert back once the market stabilized.

- 3a. The stress test assumes that extreme social distancing and/or the lockdown is effectively in place for 12 months and new home sales see weakened demand. As a result, some homes are sold at or near cost (i.e., no profit).
Due to the relatively unique aspects of each of these properties, we stress tested them on an individual basis as detailed in the footnotes.
- 4a. The property is currently 100% pre-leased. The stress test assumes that extreme social distancing and/or the lockdown is required for 12 months and no retail tenants pay their rent for the entire 12 months except for those tenants that are considered essential services and the tenants with corporate credit. The result is a projected shortfall on the annual debt service of $225,000 which is paid by Growth eREIT II.
- 4b. The property consists of 12 newly-built homes that were recently completed and currently on the market for sale, with 5 of those homes under contract as of March 31, 2020. The stress test assumes that extreme social distancing and/or the lockdown is effectively in place for 12 months and new home sales see weakened demand. As a result, all the homes are sold at cost (i.e no profit) and the lender requires 12 months of debt service covered by Los Angeles eFund.
Real estate debt and debt-like structures
Stress metric: loan to value ratio (LTV)
For real estate debt and similar fixed-income investments, we believe that fundamentally the relative relationship of our investment basis to the value of the property, as represented by the loan-to-value ratio (LTV), is the most important measure of the probability of preserving principal and return. In the stressed scenario, to determine our projected basis, we assume that income for all the loans falls to nearly zero for a 12 month period, any project under development is delayed for a 12 month period, and all senior lenders require the funding of a new 12 month interest reserve. Conversely, for the projected value of the properties we chose not to revise them under the stressed LTVs as we did not feel confident in forecasting when values will recover and in what manner. Instead, we concluded a continued reasonable assumption over the life of the investment was to use actual cost or ‘as completed’ appraisals as the measure for value.
While these stress test assumptions are broad, and in many cases feel unlikely to occur, we take additional comfort knowing that 65% of the fixed income portfolio is invested in apartments and over 95% in residential assets more broadly. Though prices (and values) may vary in the short term, we believe that well located, supply constrained real estate owned at a basis below replacement costs is fundamentally a sound value investment strategy.
Typical business plan
The Fundrise preferred equity stabilized apartment strategy, like the Fundrise equity strategy, is focused on providing well-located and reasonably priced housing for workforce renters. The primary difference being that rather than holding an equity with potential upside, we hold a preferred equity position that is senior in payment priority to the equity (this is generally considered a relatively lower risk position with a lower potential return than equity). As before, we believe these types of assets generally have better withstood past economic downturns as people tend to downsize to more affordable housing during times of economic hardship.
How we stress tested it
We stress tested each investment’s loan to value (LTV) and operating cash flow by assuming the current coronavirus crisis causes average approximate 34% economic vacancy/loss factor for 12 months, which would include actual vacancy as well as potential non-collections from tenants’ missed rent payments and bad debt.

An economic vacancy/loss factor of 34% is 2.5x higher than the existing economic vacancy/loss factor of about 9% portfolio average as of Q1 2020 and nearly 4x higher than the peak vacancy nationwide in Q1 2009 of 11.1% during the Great Recession, per data from the Federal Reserve. Since 1956 when Federal Reserve data begins tracking, the average apartment vacancy nationwide has ranged from about 5% to 11%. In other words, we believe that 34% economic vacancy is an extremely severe stress test.
We assumed the eREITs fund any potential shortfall as a result of the average 34% economic vacancy/loss factor, which adds to the principal balance. Any unpaid interest and new funding accrue at least at the standard gross interest rate.
We used the following definitions in our calculations:
Operating Cash Flow = Gross Income - Total Expenses - Debt Service For those with a detailed understanding of residential apartment underwriting, we included a replacement reserve assumption ranging between $200 - 300 per unit per year, depending on vintage and used the most recently available trailing 12-month (T-12) figures, annualizing for some assets with less than 12 months of operations.
Gross Income = Gross Rent + Other Income - Economic Vacancy (which was applied to Other Income as well as Rental Income)
- 5a. Fundrise preferred equity investment is senior to all common equity on a pooled basis for the combined portfolio of 11 apartment buildings.
Typical business plan
Financing the development of new apartment communities in fast-growing markets, primarily in the Southeast. The Fundrise preferred structure is similar to debt, where the respective eREITs are entitled to a fixed rate of return which is senior to the sponsor’s equity in terms of priority of payment but still junior to the senior loan.
How we stress tested it
We stressed potential capital needs by assuming every project is delayed by 12 months by the current coronavirus crisis, regardless of status (whether the project is just starting construction, near completion, or in lease-up). We assumed each senior lender would require the funding of an additional 12 months of interest reserve at a 5% interest rate, plus any outstanding balance of the senior loan and the applicable fund’s preferred equity investment accrue for the additional 12 month. We forecast, on a stressed basis, one project requiring a potential payment of $1 million for construction cost overrun, covered by a fund rather than the borrower, which increases the investment’s LTV basis.

Typical business plan
Nearly the entirety of the Fundrise senior debt portfolio consists of financing the entitlement or construction of mid-sized residential properties in supply-constrained California, particularly infill locations in Los Angeles. The market for this mid-sized entitlement and construction financing has proven to be inefficient and underserved by traditional banks creating opportunities for higher relative risk-adjusted returns.
How we stress tested it
We stress tested each loan’s basis by assuming all loan timelines are delayed by 12 months by the current coronavirus crisis , resulting in an increased accrued basis for each loan net of interest reserves.

- 7a. West Coast eREIT has placed the borrower in default.
- 7b. Los Angeles eFund has placed the borrower in default.
- 7c. Los Angeles eFund has placed the borrower in default.
Due to the relatively unique aspects of each of these properties, we stress tested them on an individual basis as detailed in the footnotes.
- 8a. The stress test assumes the hotel remains closed or maintains record low occupancy for 12 months. As a result, the senior lender could foreclose on Income eREIT’s preferred equity investment, which would wipe out the investment.
- 8b. The stress test assumes that extreme social distancing and/or the lockdown is required for 12 months. The stress tested loan to values (LTV) assume all tenants cease paying rent during the period and both the senior loans and the applicable fund’s preferred equity investments accrue interest for an additional 12 months without any current payments or pay downs.
Disclaimers
The information contained in this Fundrise portfolio stress test is for informational purposes only, and has not been reviewed, compiled or audited by any independent third-party or public accountant. Further, this analysis is specific to the underlying assets held by each fund sponsored by Fundrise, and is not intended to project how any particular fund will perform in the future.
Obviously we cannot predict the future, and, while we believe that the assumptions contained herein to be extremely severe, there can be no guarantee that the conditions created by the ongoing COVID-19 global pandemic, or any other future unforeseen event, will not result in greater stress on the assets than is demonstrated here. In such a scenario, there may be greater risk to the various assets than is presented in this analysis.
All of the information contained herein is based on the most recently available data as of April 2, 2020. We undertake no obligation to update or review any of the information contained herein, whether as a result of new information, future developments or otherwise.
This analysis contains numerous forward-looking statements You can identify these forward-looking statements by the use of words such as “outlook,” “believes,” “expects,” “potential,” “continues,” “may,” “will,” “should,” “could,” “seeks,” “projects,” “predicts,” “intends,” “plans,” “estimates,” “anticipates” or the negative version of these words or other comparable words. Such forward-looking statements are subject to various risks and uncertainties. Accordingly, there are or will be important factors that could cause actual outcomes or results to differ materially from those indicated in this analysis.
Fundrise, LLC (“Fundrise”) operates a website at fundrise.com and certain mobile apps (the “Platform”). By using the Platform, you accept our Terms of Service and Privacy Policy. Past performance is no guarantee of future results. Any historical returns, expected returns, or probability projections may not reflect actual future performance. All securities involve risk and may result in partial or total loss. While the data we use from third parties is believed to be reliable, we cannot ensure the accuracy or completeness of data provided by investors or other third parties. Neither Fundrise nor any of its affiliates provide tax advice and do not represent in any manner that the outcomes described herein will result in any particular tax consequence. Prospective investors should confer with their personal tax advisors regarding the tax consequences based on their particular circumstances. Neither Fundrise nor any of its affiliates assume responsibility for the tax consequences for any investor of any investment. Full Disclosure
The publicly filed offering circulars of the issuers sponsored by Rise Companies Corp., not all of which may be currently qualified by the Securities and Exchange Commission, may be found at fundrise.com/oc.
© 2020 Fundrise, LLC. All Rights Reserved. eREIT, eFund and eDirect are trademarks of Rise Companies Corp.